With the expansion of the SuperMotocross Playoff system in its second year, there has been a lot of discussion about the number of races in the year and whether it’s too many races.
We are now at 31 total races, with 28 regular season races – 17 Supercross, 11 Motocross. And then the 3 SMX Playoff rounds.
In order to compare historically, I am going to compare 1994 through present, however, I am just going to look at the regular season Supercross and Motocross rounds.
Why just back to 1994? The 500MX class existed until 1993, splitting the outdoor Motocross rounds between the 500MX and 250MX Class. Furthermore, the number of races per year dating back to 1994 has been relatively the same:
| Year | Total Rounds | SX Rounds | MX Rounds |
| 1994 | 27 | 15 | 12 |
| 1995 | 27 | 15 | 12 |
| 1996 | 28 | 15 | 13 |
| 1997 | 28 | 15 | 13 |
| 1998 | 28 | 16 | 12 |
| 1999 | 28 | 16 | 12 |
| 2000 | 28 | 16 | 12 |
| 2001 | 28 | 16 | 12 |
| 2002 | 28 | 16 | 12 |
| 2003 | 27 | 16 | 11 |
| 2004 | 28 | 16 | 12 |
| 2005 | 28 | 16 | 12 |
| 2006 | 28 | 16 | 12 |
| 2007 | 28 | 16 | 12 |
| 2008 | 29 | 17 | 12 |
| 2009 | 29 | 17 | 12 |
| 2010 | 29 | 17 | 12 |
| 2011 | 29 | 17 | 12 |
| 2012 | 29 | 17 | 12 |
| 2013 | 29 | 17 | 12 |
| 2014 | 29 | 17 | 12 |
| 2015 | 29 | 17 | 12 |
| 2016 | 29 | 17 | 12 |
| 2017 | 29 | 17 | 12 |
| 2018 | 29 | 17 | 12 |
| 2019 | 29 | 17 | 12 |
| 2020 | 26 | 17 | 9 |
| 2021 | 29 | 17 | 12 |
| 2022 | 29 | 17 | 12 |
| 2023 | 28 | 17 | 11 |
| 2024 | 28 | 17 | 11 |
So how many riders race 100% of the rounds per year? How much has this changed historically? Is there any patterns or trends?
Lets find out, onto the data. Note: I am just looking at the Premier Class for this breakdown.
Riders to Race 100% of Races
| Year | Total Rounds | Riders to Race 100% of Races |
| 1994 | 27 | 1 |
| 1995 | 27 | 2 |
| 1996 | 28 | 4 |
| 1997 | 28 | 5 |
| 1998 | 28 | 4 |
| 1999 | 28 | 6 |
| 2000 | 28 | 6 |
| 2001 | 28 | 2 |
| 2002 | 28 | 2 |
| 2003 | 27 | 3 |
| 2004 | 28 | 6 |
| 2005 | 28 | 4 |
| 2006 | 28 | 3 |
| 2007 | 28 | 3 |
| 2008 | 29 | 2 |
| 2009 | 29 | 3 |
| 2010 | 29 | 2 |
| 2011 | 29 | 3 |
| 2012 | 29 | 1 |
| 2013 | 29 | 6 |
| 2014 | 29 | 3 |
| 2015 | 29 | 2 |
| 2016 | 29 | 2 |
| 2017 | 29 | 4 |
| 2018 | 29 | 1 |
| 2019 | 29 | 4 |
| 2020 | 26 | 1 |
| 2021 | 29 | 4 |
| 2022 | 29 | 2 |
| 2023 | 28 | 0 |
| 2024 | 28 | 4 |
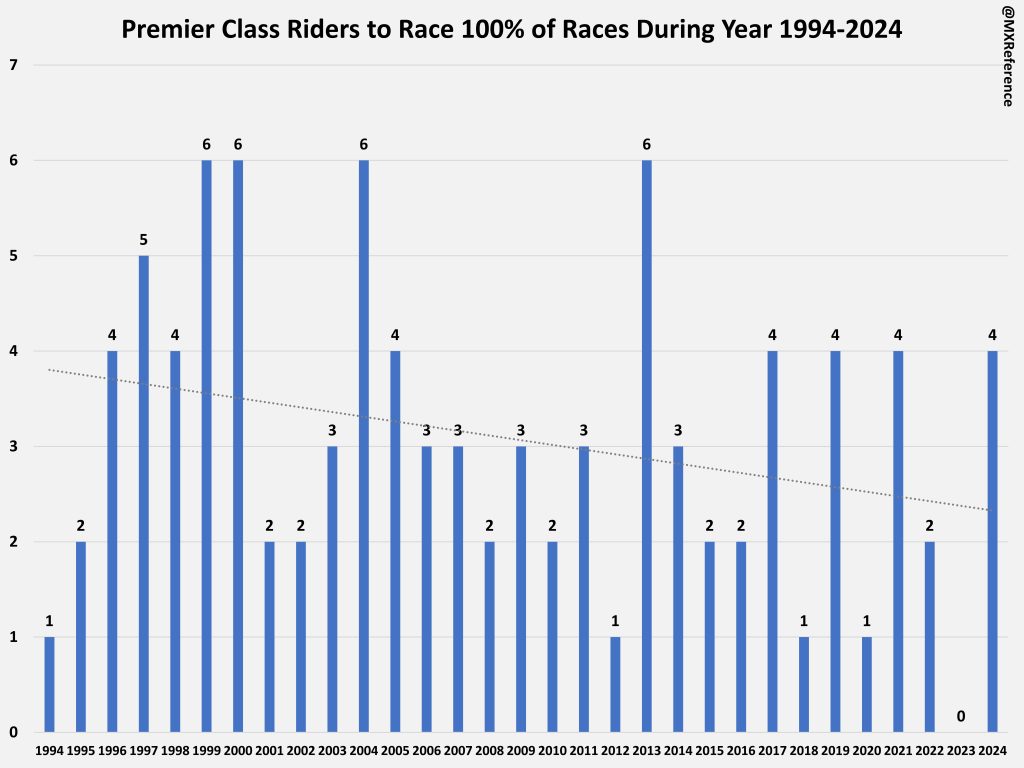
Table visualized into a chart:

One thing to keep in mind is this only counts riders who made the Main Event for Supercross rounds, so if a rider failed to qualify despite being at the race, that will not count towards the total.
- Over the last 31 years, an average of 3.06 riders race 100% of the Premier Class races per year.
- The highest we have seen is 6 riders, this occurred in 1999, 2000, 2004 and 2013.
- Surprisingly, only once since 1994 have zero riders raced at every round of SX and MX – in 2023
What about if we adjust to see who races 95% of the races or more?
Riders to Race >=95% of Races
| Year | Total Rounds | Race 100% of Races | Race >=95% of Races |
| 1994 | 27 | 1 | 4 |
| 1995 | 27 | 2 | 5 |
| 1996 | 28 | 4 | 5 |
| 1997 | 28 | 5 | 6 |
| 1998 | 28 | 4 | 4 |
| 1999 | 28 | 6 | 7 |
| 2000 | 28 | 6 | 6 |
| 2001 | 28 | 2 | 6 |
| 2002 | 28 | 2 | 4 |
| 2003 | 27 | 3 | 5 |
| 2004 | 28 | 6 | 6 |
| 2005 | 28 | 4 | 4 |
| 2006 | 28 | 3 | 4 |
| 2007 | 28 | 3 | 3 |
| 2008 | 29 | 2 | 3 |
| 2009 | 29 | 3 | 3 |
| 2010 | 29 | 2 | 3 |
| 2011 | 29 | 3 | 4 |
| 2012 | 29 | 1 | 5 |
| 2013 | 29 | 6 | 7 |
| 2014 | 29 | 3 | 4 |
| 2015 | 29 | 2 | 4 |
| 2016 | 29 | 2 | 3 |
| 2017 | 29 | 4 | 4 |
| 2018 | 29 | 1 | 4 |
| 2019 | 29 | 4 | 4 |
| 2020 | 26 | 1 | 4 |
| 2021 | 29 | 4 | 5 |
| 2022 | 29 | 2 | 4 |
| 2023 | 28 | 0 | 0 |
| 2024 | 28 | 4 | 5 |
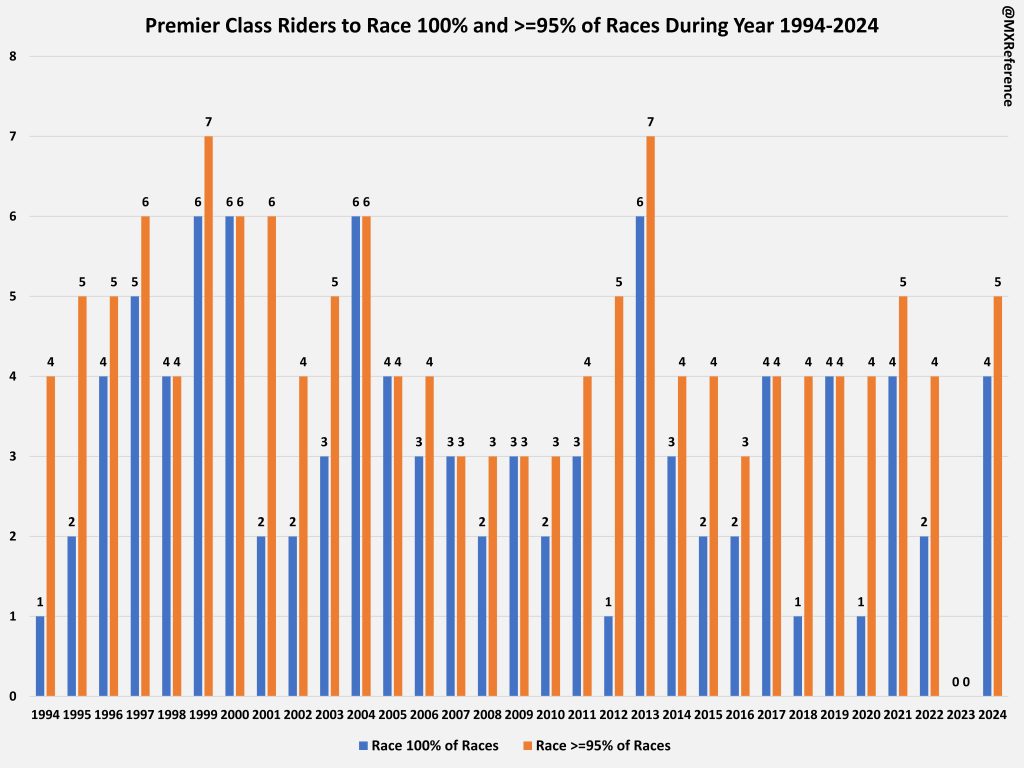
Table visualized into a chart:

- Over the last 31 years, an average of 4.35 riders race >=95% of the Premier Class races per year.
- In some years we see some larger jumps say from 1 to 4, but in most years there really isn’t much change from 100% to >=95%
Yearly Averages for Different Percentages
| 100% | >95% | >90% | >85% | >80% | |
| Yearly Average | 3.06 | 4.35 | 4.94 | 6.81 | 7.71 |
We can see the averages go up and the percentage of races goes down, however, it was a bit of a surprise that on average only 7.71 riders complete 80% or more of the races in a given year.
Which Riders have the Most 100% Race Seasons?
| Rank | Rider | 100% Season Count | Years |
| 1 | Mike LaRocco | 6 | 1994, 1996, 1998-2001 |
| 2 | Larry Ward | 5 | 1995, 1997-2000 |
| Kevin Windham | 5 | 2000-2001, 2004-2005, 2007 | |
| Ricky Carmichael | 5 | 2000, 2002-2003, 2005-2006 | |
| Ryan Dungey | 5 | 2010-2011, 2013-2015 | |
| Eli Tomac | 5 | 2016-2017, 2019-2021 | |
| 7 | Chad Reed | 4 | 2003, 2004, 2009, 2011 |
| Nicholas Wey | 4 | 2004, 2006, 2010-2011 | |
| Andrew Short | 4 | 2008-2009, 2013-2014 | |
| Ken Roczen | 4 | 2014, 2016, 2019, 2021 |
Mike LaRocco leads the way here, not too surprising. But even the great talents here don’t always complete all the races every year.
So in reality, its historically common that only a handful of riders race every round in a season. It will be interesting to see these figures going forward. Maybe SMX incentivizes more race participation but its too early to tell. I actually don’t see these figures changing much at all, injuries are too common in the sport.
In fact in the seasons with 26 or 27 rounds, the average amount of riders racing every round is 1.75.
In seasons with 28 rounds (the current amount), the average amount of riders racing every round is 3.77.
In seasons with 29 rounds, the average amount of riders racing every round is 2.71.
So on average seasons with 29 rounds have more riders racing every round than in seasons with 26 or 27 races. I think its safe to say its pretty random!
Thanks for reading! Any questions, hit me up on Twitter or Instagram: @MXReference


