In recent years, the 450 Supercross class has felt very start dependent – “Startcross.” While the starts are have always been incredibly important, last year felt especially this way. And the data showed it – so how does 2025 compare to the last 10 years of Supercross?
Overall, I think this year felt less “Startcross-ish” than last year. But that is purely based on feel. Lets see what the data showed:
Note: I am treating Triple Crown Main Events/Races (whatever we call them) the same as regular main events. Think of this as just total gate drops. I know this isn’t perfect but I think it wouldn’t make sense to leave them out.
Race Winners
The race winners (including individual Triple Crown races) average holeshot position in 2025 was: 4.39
How does this compare to recent years?
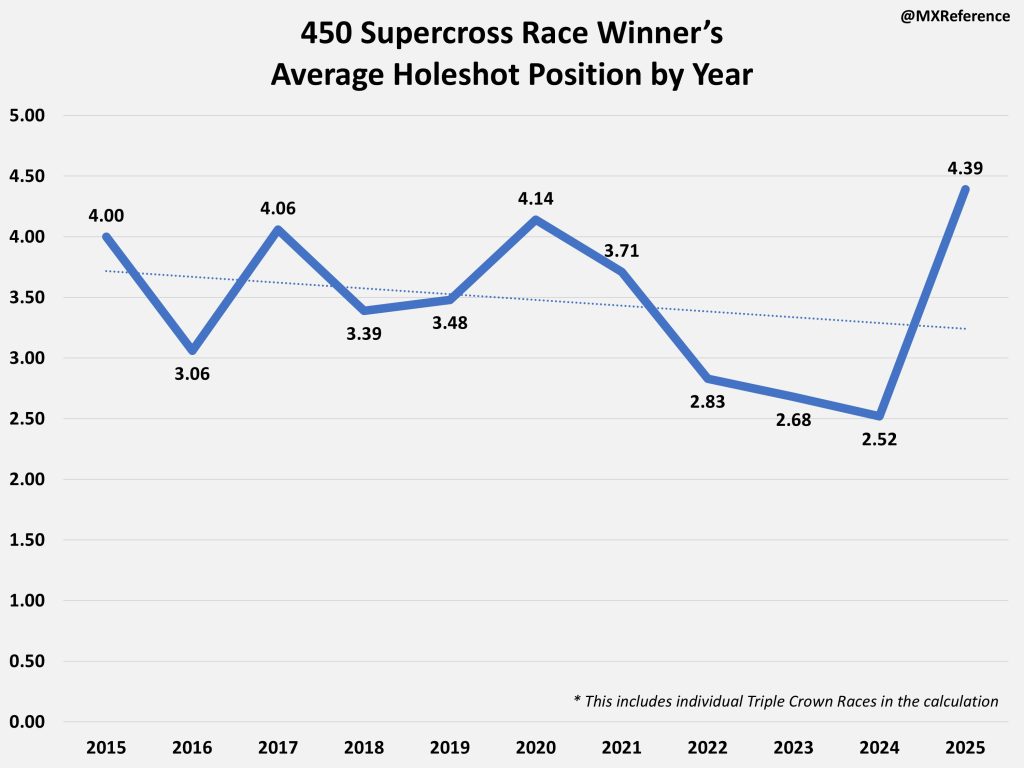
Big jump from the last few years!
I think we can attribute this to injuries compared to last year. After Tomac and Jett exited the series this year after Tampa, Webb and Sexton won 10/12 overall rounds. Including Triple Crown individual races, Webb and Sexton won 13/16 races to finish out.
The lowest a race winner holeshot was Chase Sexton in Philly – where he holeshot 13th.
So how often did race winners holeshot in the Top 3 or Top 5?
Race winners holeshot in the Top 3 in 52.17% of the races. They holeshot Top 5 in 69.57% of races.
This is actually a big drop off compared to the last few years:
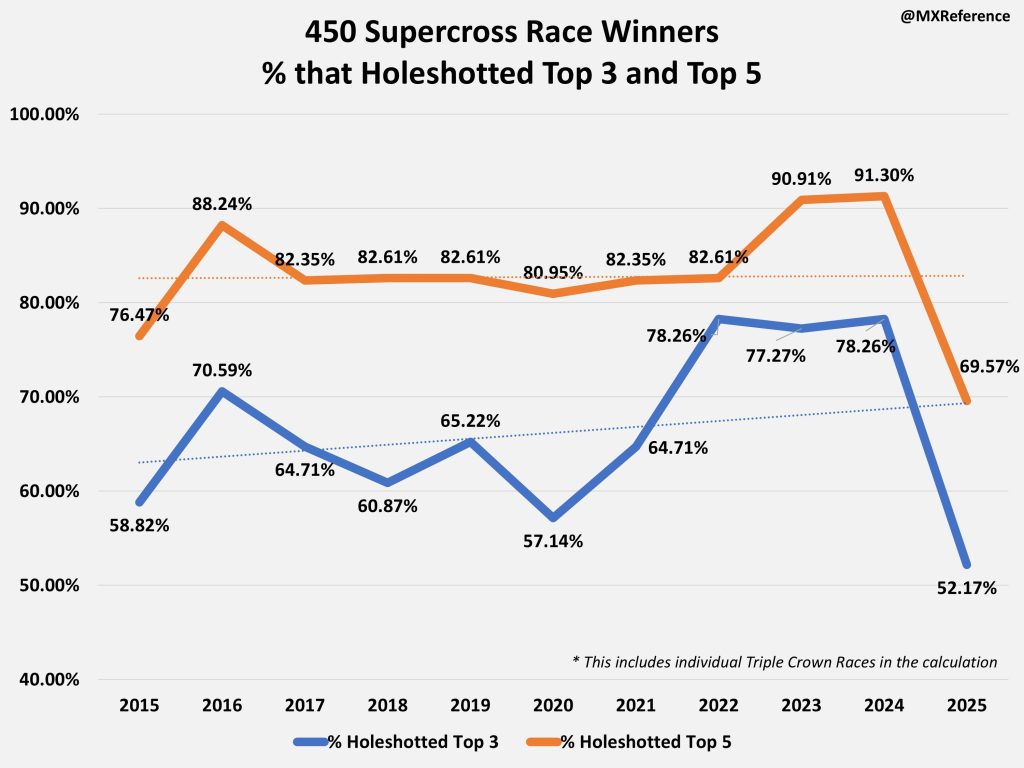
Pretty wild that last year 91.30% of race winners holeshot in the top 5 compared to this year. So I guess its safe to say this year was way less start dependent based on this data.
So how did the actual rider who got the holeshot fare this year?
Rider with Holeshot
The rider with the holeshot in 2025 had an average race finish of 5.04.
Only three riders finished outside the Top 10 in a race who had the holeshot:
- 11th Place – Justin Cooper at Foxborough. This was the crazy mud race, also he was penalized two positions down to 11th.
- 14th Place – Jorge Prado at Anaheim 1
- 15th Place – Vince Friese at San Diego
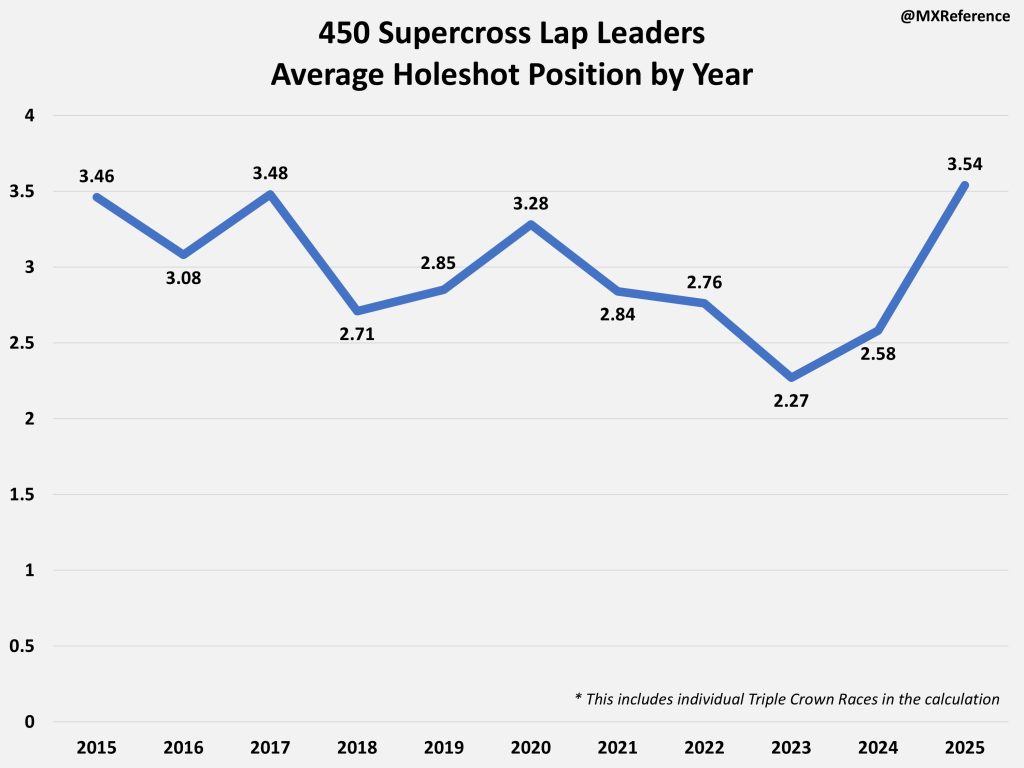
But this was still an increase over last year:
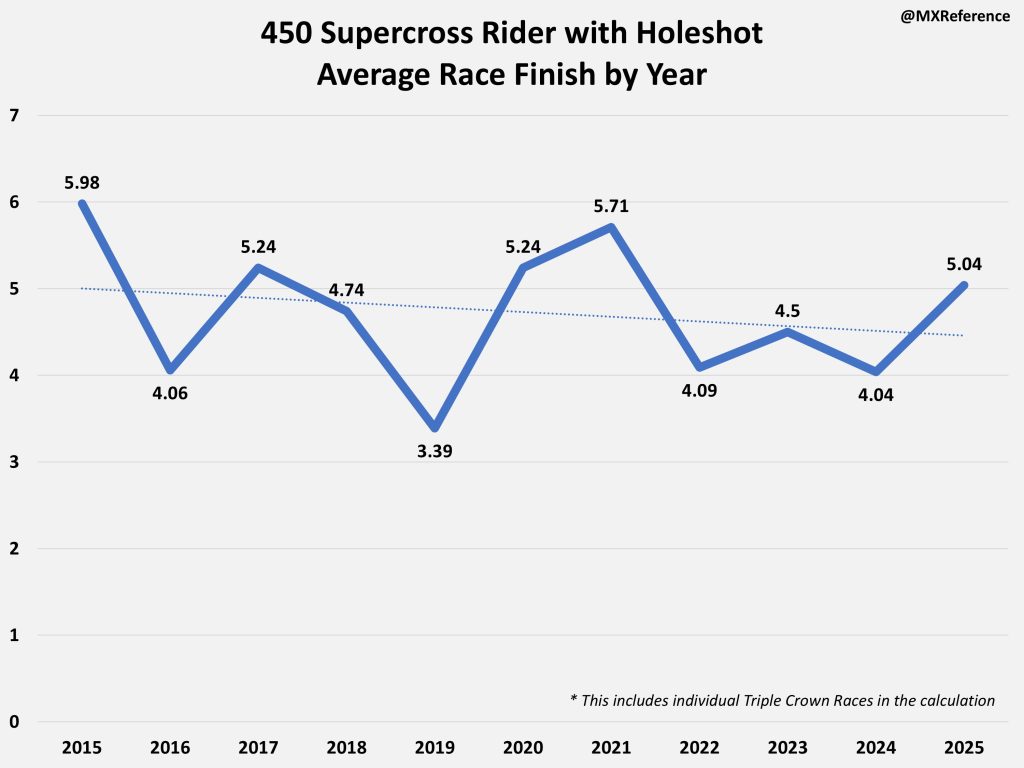
A full position on average worse than 2024 – 4.04. Historically not that bad compared back to 2015 though. But 2022-2024 once again stick out with their consistency.
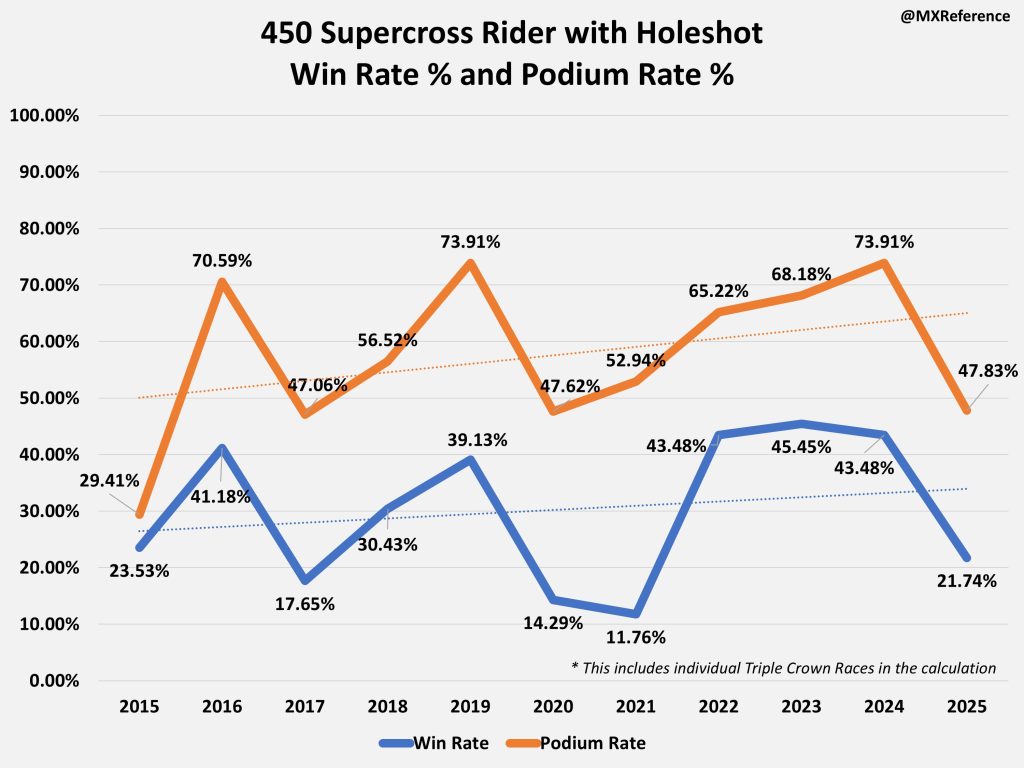
The win rate and podium rate for the rider with the holeshot took a huge drop off from last year. From 2022-2024, the rider with holeshot won over 40% of the time. This year? Just 21%
Furthermore, last year the rider with the holeshot was on the podium nearly 75% of the time. This year? Just under half the time at 47.83%.
Lap Leaders
Once again, we see the holeshot position being lower on average for another metric. This time were looking at lap leaders. This includes any instance of a rider leading a lap. So even if they led just one lap during a race, that instance is included.
The lowest holeshot position of a rider who led a lap was 13th – Chase Sexton in Philly.
Total Correlation
If we look at every instance of a rider’s holeshot position and their eventual race finish, what is the correlation between those figures?
For 2025, this was a correlation of 0.650.
Reminder correlation goes from -1 to 1, so this is a fairly high positive correlation, how does this compare to other years?
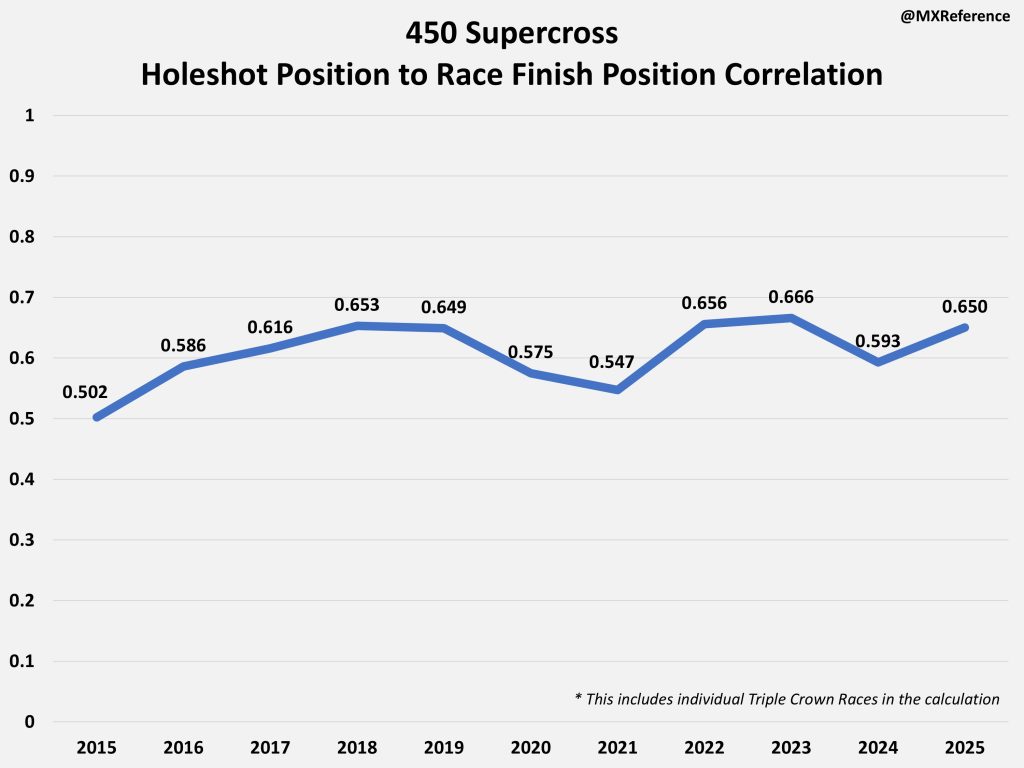
In this case we actually see a higher correlation than 2024! And it pretty much matches the correlation highs we have seen previously.
But wait, didn’t the other stats say that this year was less start dependent? Yes, they did. However, those were focused on Wins, Podiums, and Laps Led. Kind of ignoring the other, lower positions in a main event.
It seems at the top end, we saw less “startcross,” but after the top end we see more consistency (I attribute this to all the factory rider injuries we saw this year). This is more apparent in the next stat I’ll show…
Holeshot Average Rank vs Race Finish Average Rank
For this next one I am doing a rank correlation between Holeshot Average Position Rank vs Race Finish Average Position Rank.
![]()
Correlation of 0.955! Remember, 1.0 is a perfect correlation.
I have to point out a caveat here in that there is a bit of data manipulation here, so take this with a grain of salt. This is only a sample size of 20 (only 20 riders had >50% of gate drops). But I’ll show this compared to other years for consistency.
Anyways, we can see at the high end a bit more variation compared to the low end.
Malcolm Stewart has the 9th best Holeshot Average here vs the 5th best Average Race Finish.
Meanwhile, Joey Savatgy: 12th best Holeshot Average and 12th Best Race Finish Average. Mitchell Oldenburg was the same, but for 13th, etc.
This was the highest correlation dating back to 2015:
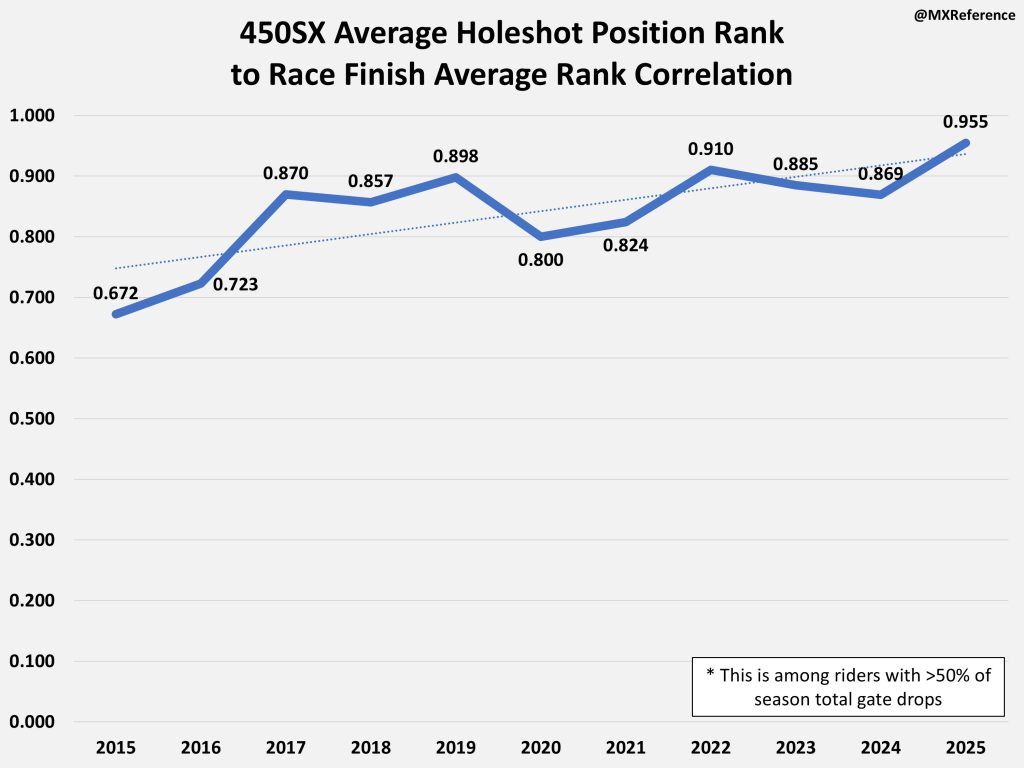
The highest we have seen since 2015!
So its hard to say whether or not the 2025 season was more or less start dependent. I think it is definitely fair to say for the Top 5 spots in a main event it was less start dependent. Again, mostly due to injuries of the factory riders throughout the year. But after the factory riders it seems to be more correlated than previous years.
It is important to remember that these last two stats were just a correlation, which doesn’t give us any predictive measures. I plan do an article during the offseason doing a regression analysis on all this holeshot data to see how statistically predictive holeshot positions are.
Anyways, I’ll keep tracking all this data going forward. It will be interesting to see how this all plays out over the next 5-10 years!
Thanks for reading! Any questions, hit me up on Twitter or Instagram: @MXReference