I recently compared all the manufacturers’ average starts by year in Supercross – you can read that here.
Now its time for Motocross. However, I will only be comparing back to 1998. This is due to wanting to compare all 40 riders on the gate and the data is incomplete for the years before 1998. In the Cycle News archives, the races from ~1900 to 1997 typically have all 40 riders listed in the results. But there are a few races here and there each year that only show the top 20 for overalls in those years. From 1998, all 40 riders results are available.
I will also show the correlations between Motocross and Supercross for each manufacturer.
But first here is the chart showing all the manufacturers since 1998 (I’ll break down each individually):
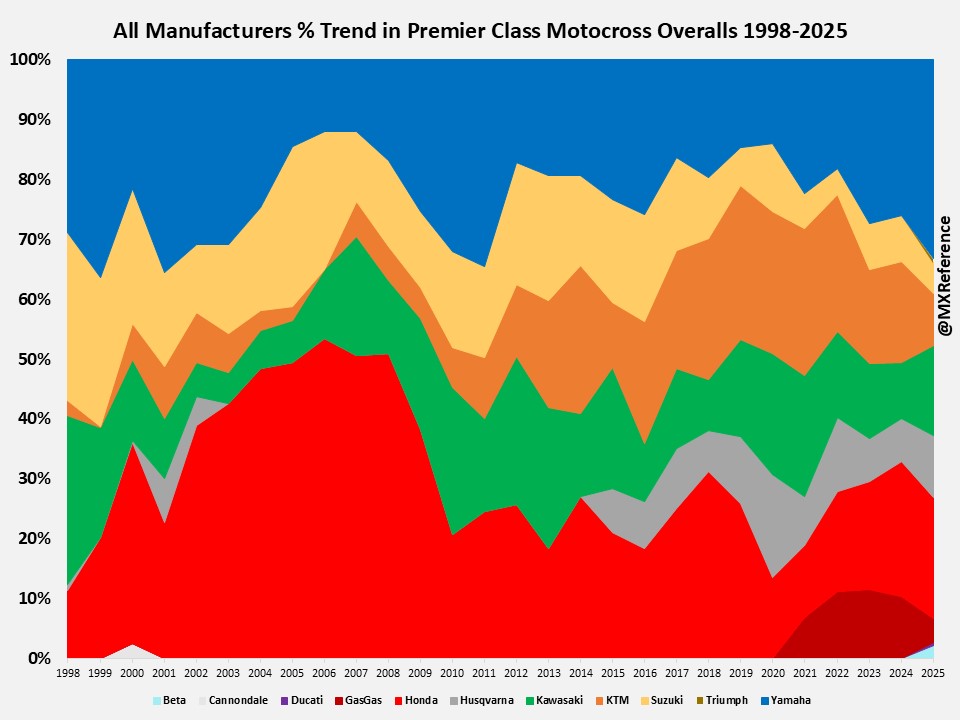
You can see Honda domination in the 2000s and then a steep drop off. Even Cannondale shows up this chart – just in the year 2000. In recent years, and 2025 in particular you can (barely) see GasGas, Beta, Triumph and Ducati.
Here is the same chart since 2010:
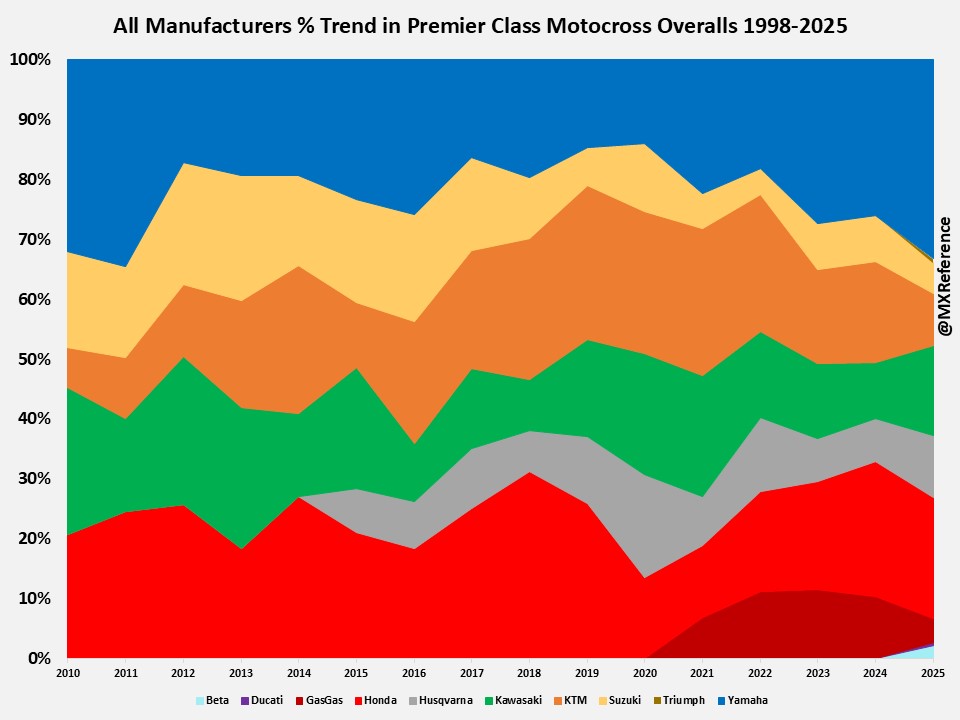
The other brands are a bit more visible in this one, but still barely there. Lets get into induvidual brands.
Honda
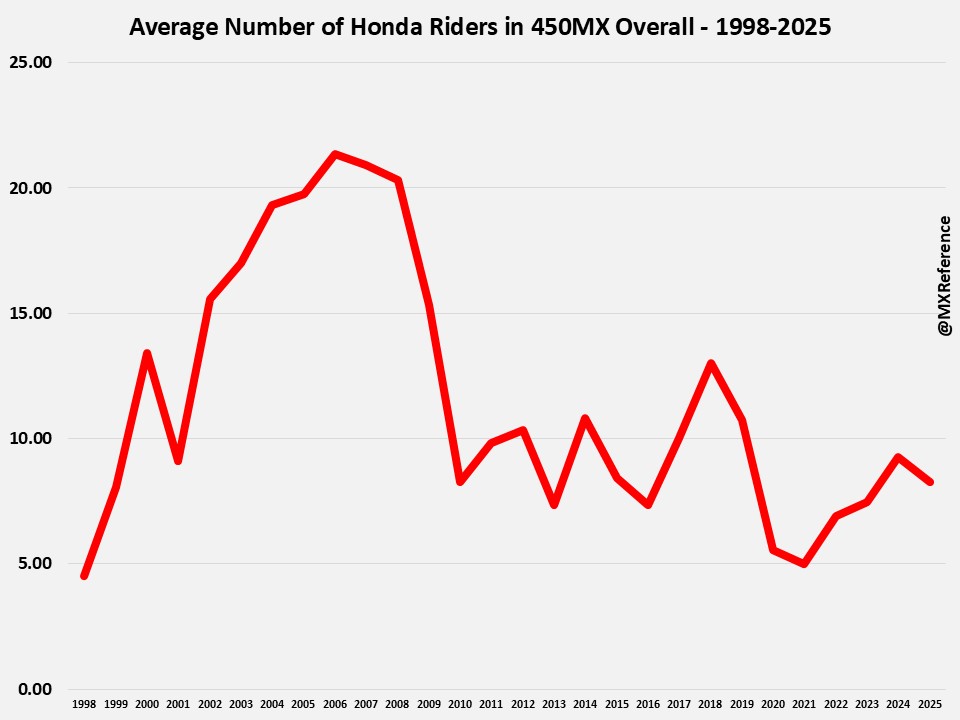 Honda in the late 2000s had quite a lot riders in the overall. In 2006, 2007 and 2008, Honda had more than half the riders in the MX overall. This was followed by a steep decline after 2009. Its been mostly flat since then on average. Its a pretty impressive increase from 1998 to 2008, but then the drop off is pretty huge. 2021 saw the lowest figure since 1998.
In the 28 seasons shown here, Honda has had the highest average in 14 of 28. In 2025, Honda had 8.27 riders per overall.
How does this correlate with Supercross since 1998?
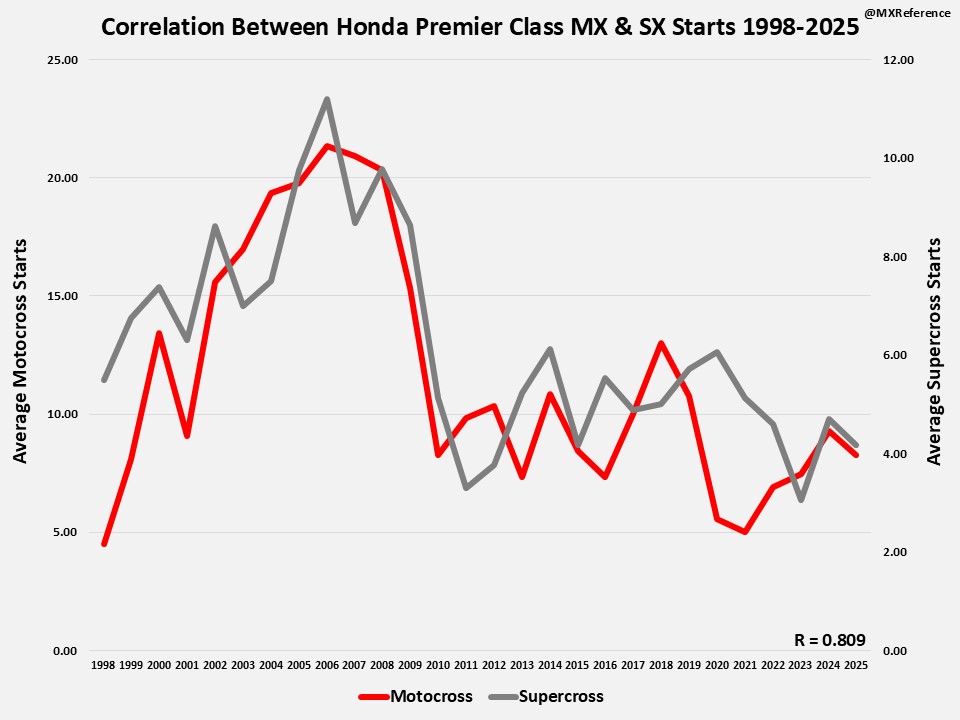
To explain this chart, the line in the manufacturer color (Honda in this case) is lined up to the left Y axis 0 – 25, Motocross. The line in grey is lined up to the right Y axis 0 – 12, Supercross. This is to sort of equalize with 40 riders in MX and 20/22 in SX.
Honda has a very high correlation of 0.809 (not surprising). However, the rest of the manufacturers differ in correlation levels.
Yamaha
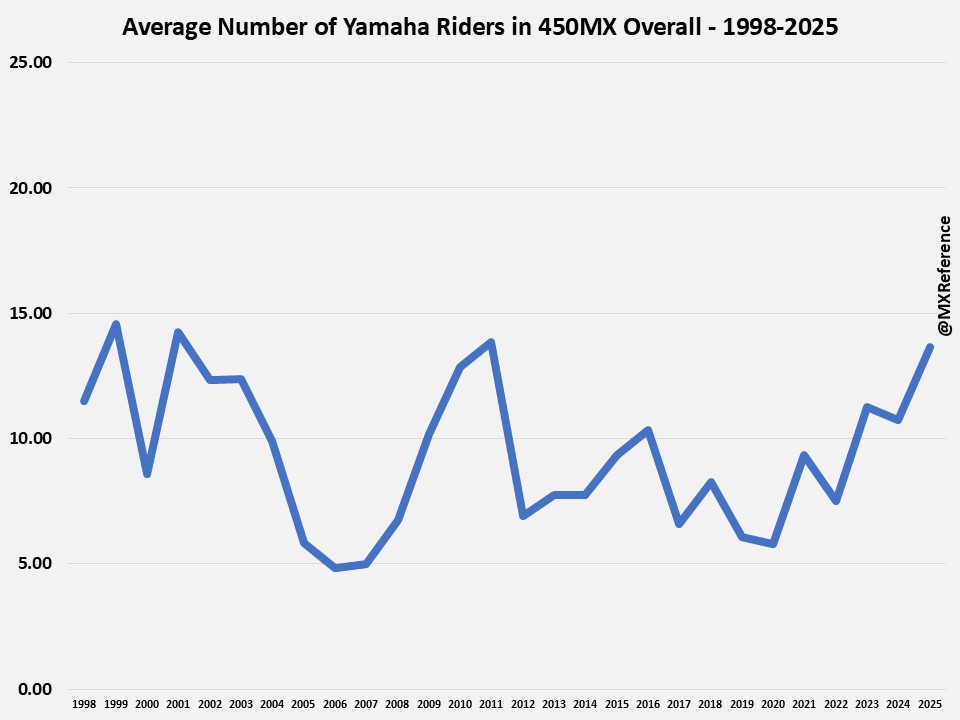
Yamaha has had the highest amount of riders in the overall in 10 of 28 seasons since 1998. What is interesting to me here is the low level in 2006-2007 and then large increase and then drop off again. The large increase from roughly 2009-2011 is very surprising to me as this was (in my memory) the peak of the “Yamaha 450 is bad” era, aka the James Stewart Yamaha era. James Stewart only participated in one outdoor race on a Yamaha, however, in my memory the consensus about the Yamaha 450 in this period was very negative. But we see a large increase in bikes here. This was the era of no official factory team for Yamaha as they supported various teams including JGR and San Manuel/L&M at the time. Was this maybe due to more support across teams or a contingency increase? Would love to know the answer to this!
Meanwhile, Yamaha had 13.64 riders per overall in 2025.
How does this correlate to Supercross for Yamaha?
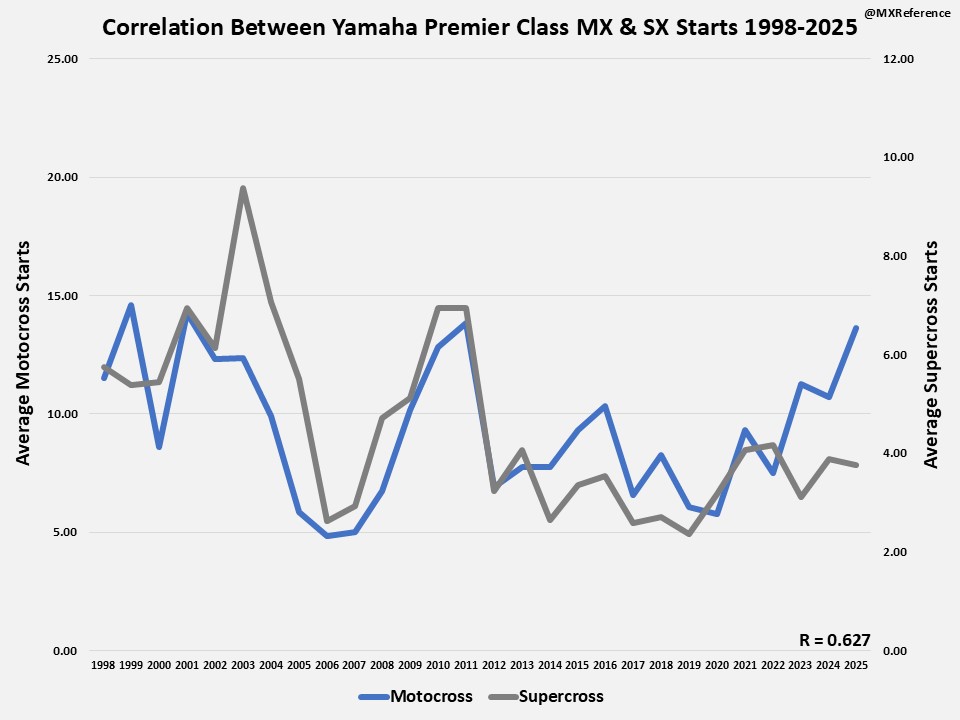
Pretty strong at 0.627 but not as close as Honda, the big divergence here is in the the early 2000s and the last few years.
Kawasaki
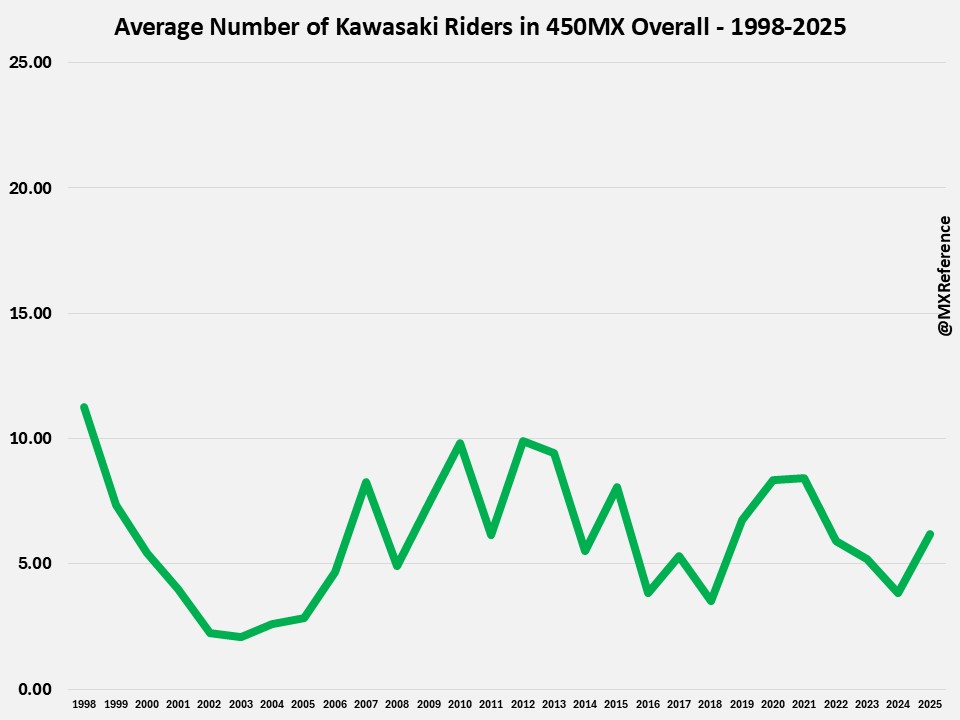
Kawasaki has had the most riders since on average in a year just one time since 1998: 2013. There was a big drop off here in the early 2000s and then it recovered and has stayed roughly stagnant since then. Kawasaki averaged 6.18 riders per overall in 2025.
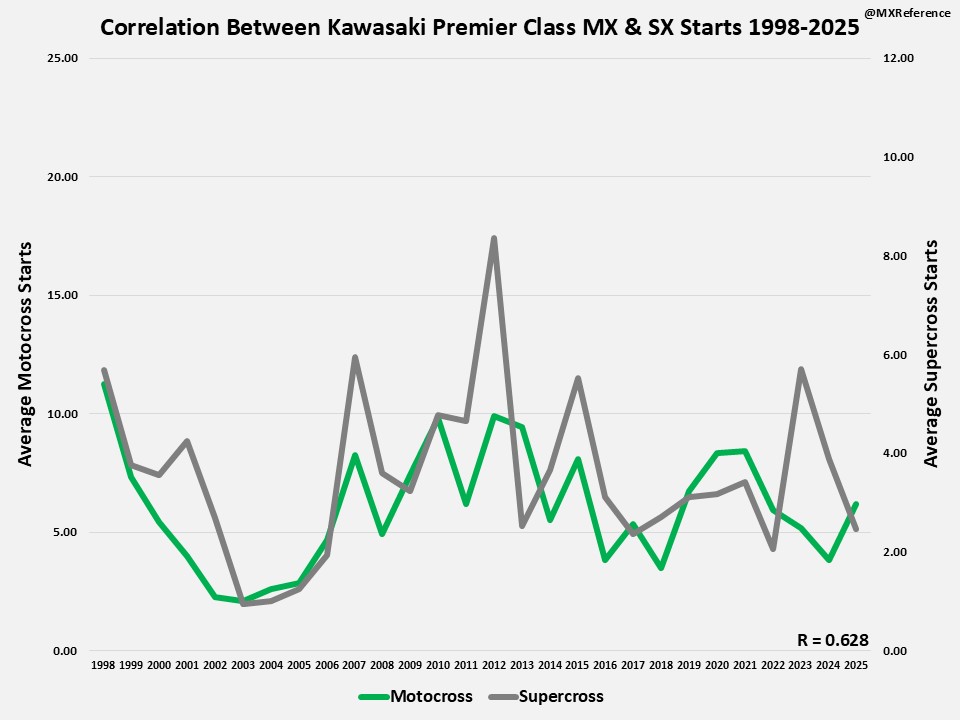
A correlation of 0.628 – one thousandth more than Yamaha. Pretty crazy they are that similar over a 28 year period. The divergences here seem a bit more pronounced but there are a lot of very close years here too.
Suzuki
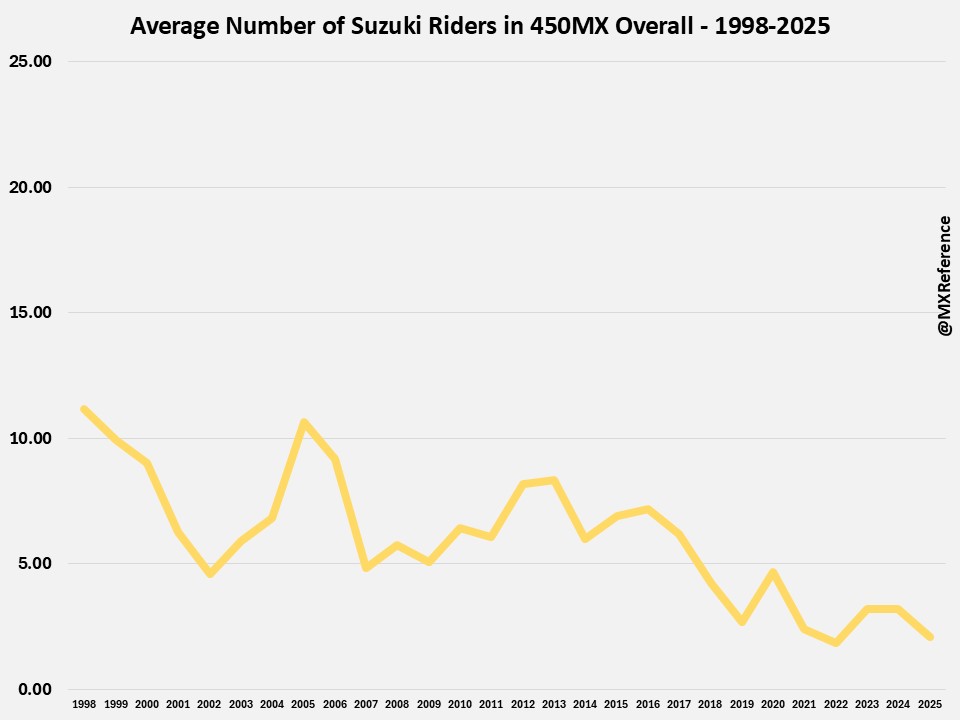
Its been a slow steady decline for Suzuki outdoors on average. There’s a bit of a recovery in 2005, but its basically been downhill since then. In 2025, Suzuki had an average of just 2.09 riders per overall.
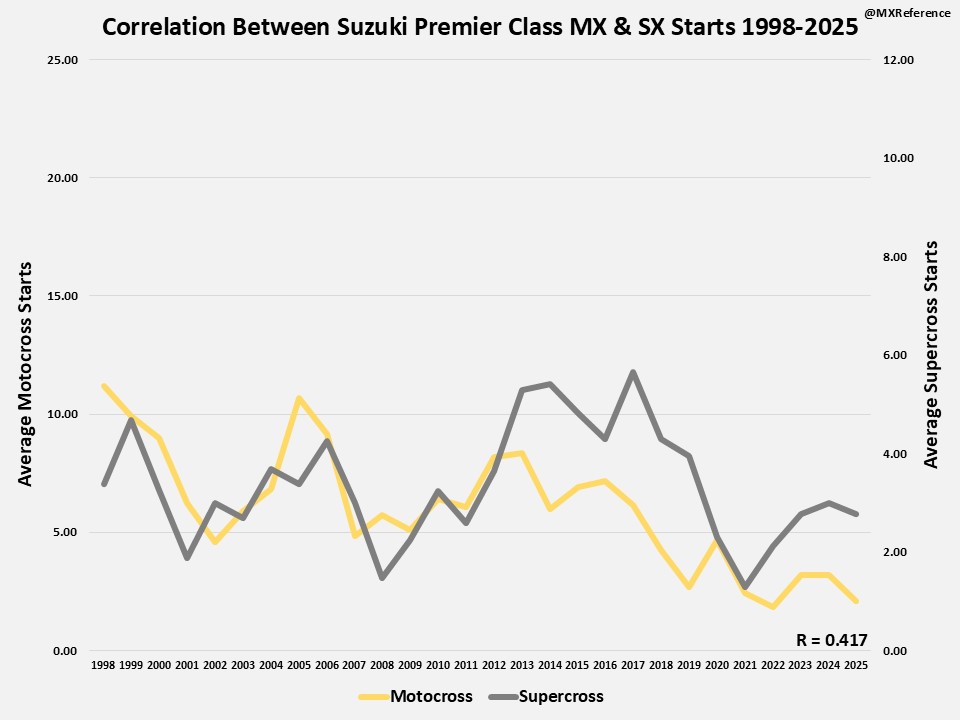
Suzuki has the lowest correlation of manufacturers in these charts at 0.417. Still a strong correlation in general, but in comparison its low to the other bikes. Quite a divergence in the mid to late 2010s for Suzuki, which is interesting. In the last few years it makes more sense with Roczen and Chiz riding SX on Suzuki and not competing in many outdoor races.
KTM
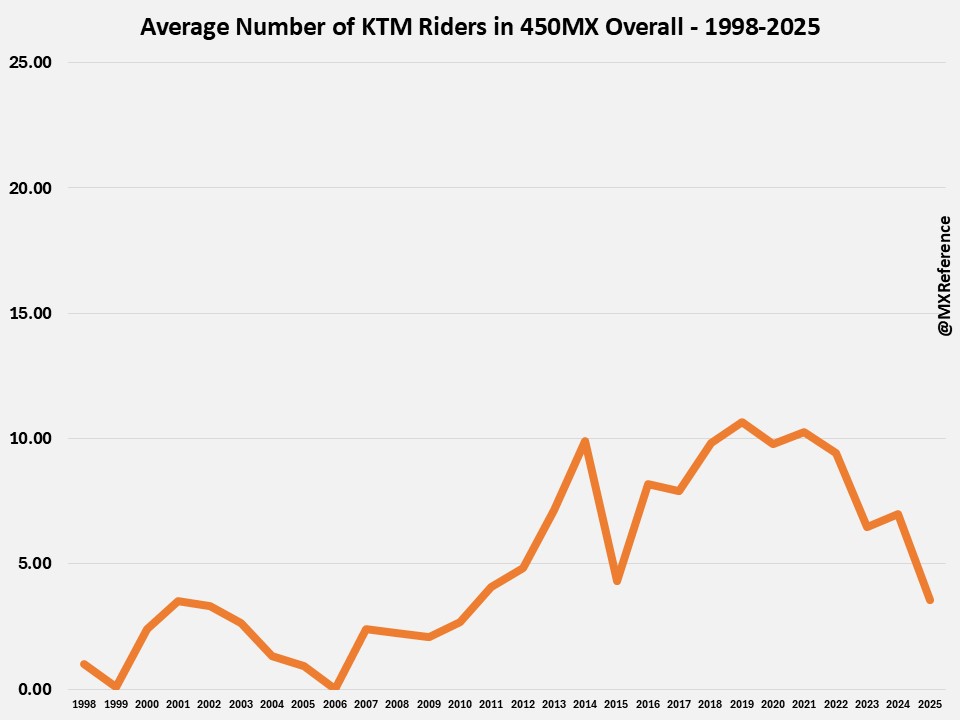
KTM has an interesting history in MX since 1998. In 2006, they had zero riders the whole season, however, they have still trended upwards. 2020 through 2022, KTM had the highest amount of riders on average. In 2025, the brand had just 3.55 riders per overall on average. The drop off from 2014 to 2015 makes sense with Husqvarna as part the KTM group being introduced that year.
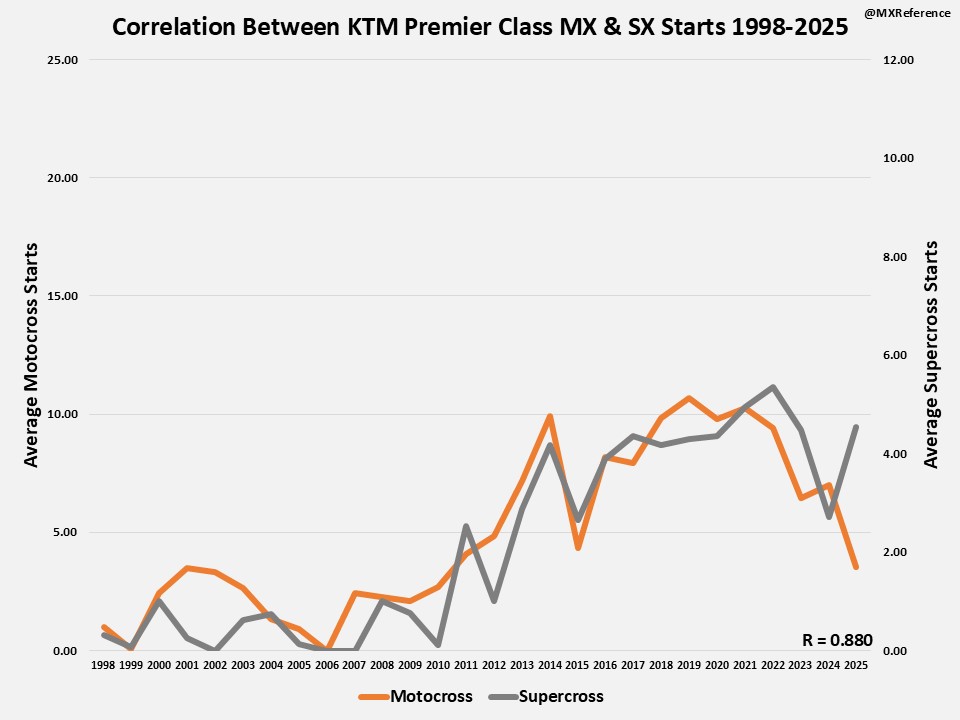
The KTM correlation is even higher than Honda’s – the only real divergence here is 2025. But its still not the highest…
Husqvarna
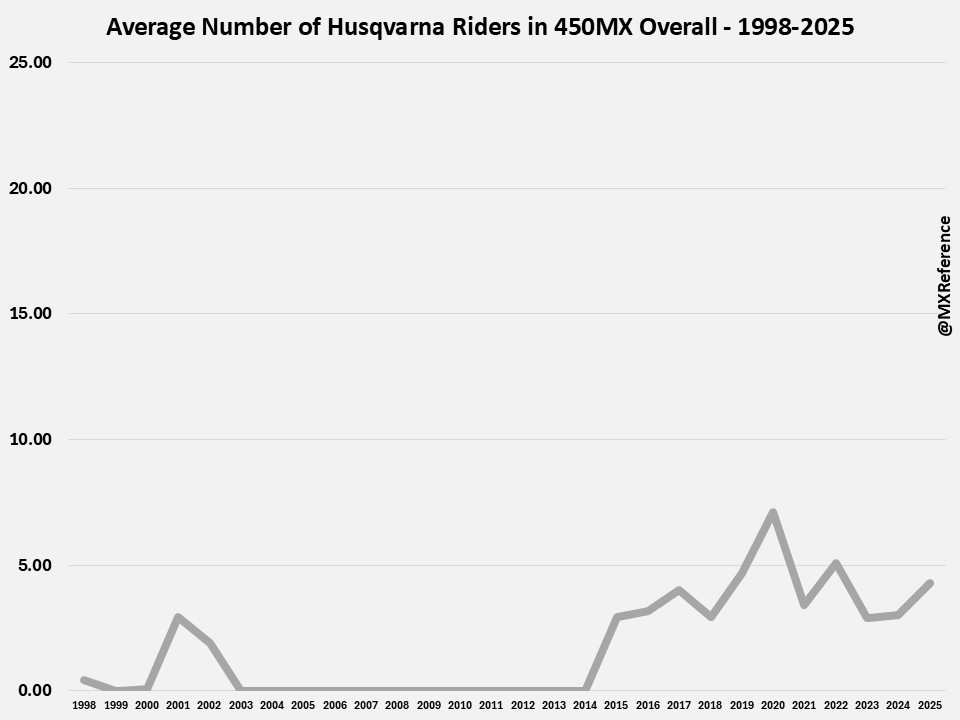
Husqvarna’s history here is very interesting with the brand being re-introduced in 2015. Husqvarna had 4.27 riders per overall in 2025 – the first year the brand had a higher average then KTM (since 2015).
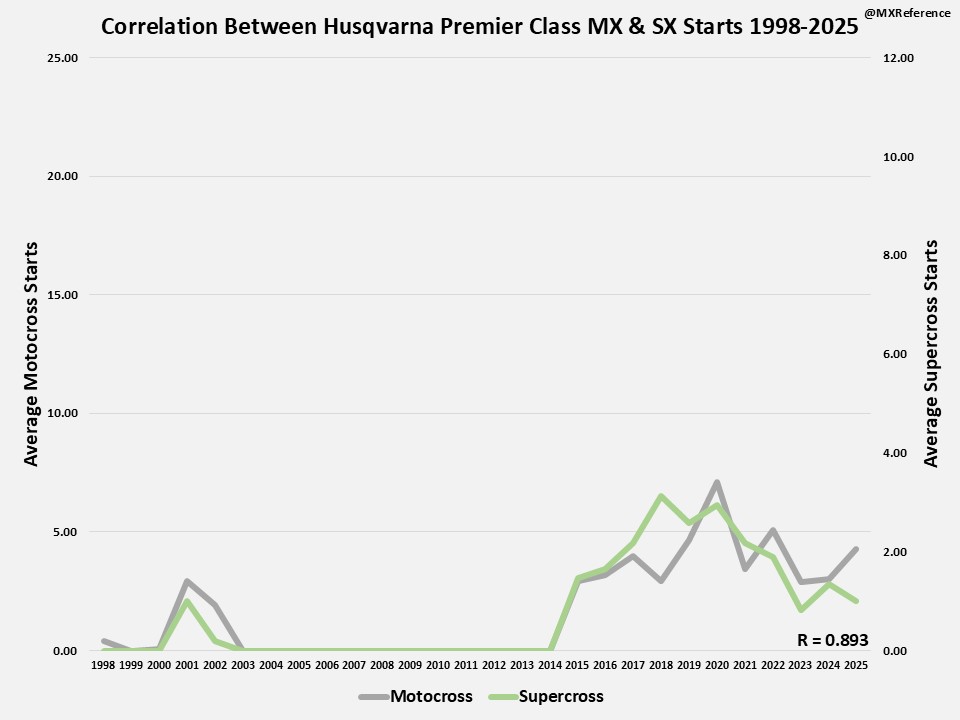
I changed the colors here to make this readable. Supercross is now in a light green color for this chart.
Husqvarna has the highest correlation here – in large part for having nothing from 2003 to 2014. Without those years, it is 0.794.
Other Brands
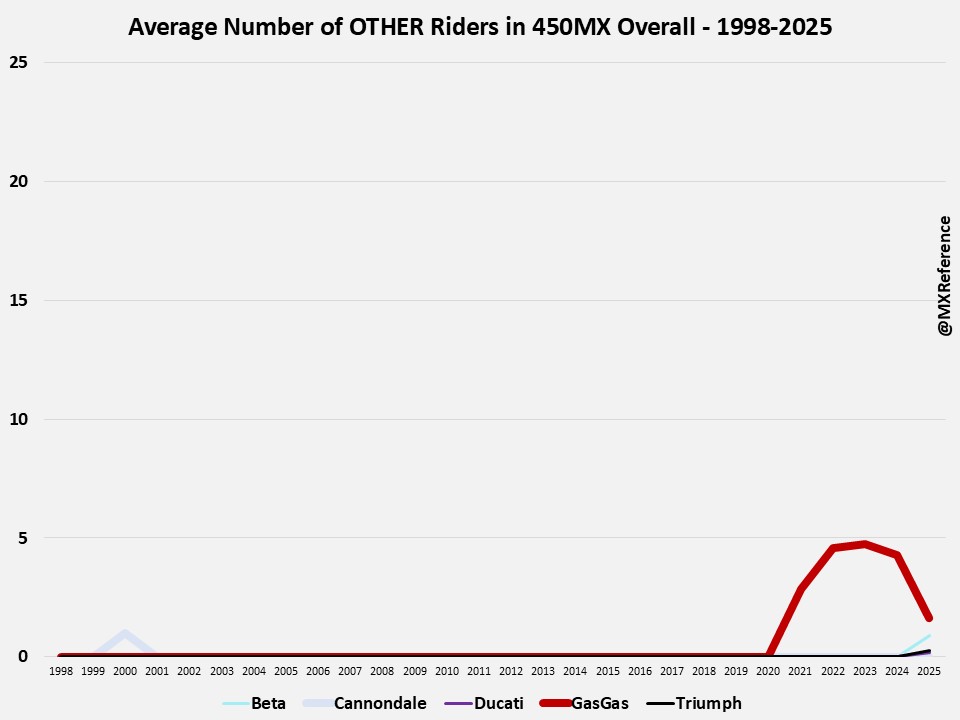
Here is a chart of the other brands since 1998 in Pro Motocross. I basically included this to show Cannondale in 2000. Only GasGas has really anything of note in this chart. GasGas had 1.64 riders per overall this year. Beta, Ducati and Triumph should be higher in the coming years. Jackson Gray rode the last 3 rounds in Motocross this year on a Triumph. Antonio Cairoli rode two rounds on Ducati and got a 10th place in one of the motos.
Not enough data to compare these brands with correlations.
I’ll have a chart of all the raw data numbers at the bottom of this article.
Thanks for reading! Any questions, hit me up on Twitter or Instagram: @MXRefence
| Year | Beta | Cannondale | Ducati | GasGas | Honda | Husqvarna |
| 1998 | 0.00 | 0.00 | 0.00 | 0.00 | 4.50 | 0.42 |
| 1999 | 0.00 | 0.00 | 0.00 | 0.00 | 8.08 | 0.00 |
| 2000 | 0.00 | 1.00 | 0.00 | 0.00 | 13.42 | 0.08 |
| 2001 | 0.00 | 0.00 | 0.00 | 0.00 | 9.08 | 2.92 |
| 2002 | 0.00 | 0.00 | 0.00 | 0.00 | 15.58 | 1.92 |
| 2003 | 0.00 | 0.00 | 0.00 | 0.00 | 17.00 | 0.00 |
| 2004 | 0.00 | 0.00 | 0.00 | 0.00 | 19.33 | 0.00 |
| 2005 | 0.00 | 0.00 | 0.00 | 0.00 | 19.75 | 0.00 |
| 2006 | 0.00 | 0.00 | 0.00 | 0.00 | 21.33 | 0.00 |
| 2007 | 0.00 | 0.00 | 0.00 | 0.00 | 20.92 | 0.00 |
| 2008 | 0.00 | 0.00 | 0.00 | 0.00 | 20.33 | 0.00 |
| 2009 | 0.00 | 0.00 | 0.00 | 0.00 | 15.33 | 0.00 |
| 2010 | 0.00 | 0.00 | 0.00 | 0.00 | 8.25 | 0.00 |
| 2011 | 0.00 | 0.00 | 0.00 | 0.00 | 9.83 | 0.00 |
| 2012 | 0.00 | 0.00 | 0.00 | 0.00 | 10.33 | 0.00 |
| 2013 | 0.00 | 0.00 | 0.00 | 0.00 | 7.33 | 0.00 |
| 2014 | 0.00 | 0.00 | 0.00 | 0.00 | 10.83 | 0.00 |
| 2015 | 0.00 | 0.00 | 0.00 | 0.00 | 8.42 | 2.92 |
| 2016 | 0.00 | 0.00 | 0.00 | 0.00 | 7.33 | 3.17 |
| 2017 | 0.00 | 0.00 | 0.00 | 0.00 | 10.00 | 4.00 |
| 2018 | 0.00 | 0.00 | 0.00 | 0.00 | 13.00 | 2.92 |
| 2019 | 0.00 | 0.00 | 0.00 | 0.00 | 10.75 | 4.67 |
| 2020 | 0.00 | 0.00 | 0.00 | 0.00 | 5.56 | 7.11 |
| 2021 | 0.00 | 0.00 | 0.00 | 2.83 | 5.00 | 3.42 |
| 2022 | 0.00 | 0.00 | 0.00 | 4.58 | 6.92 | 5.08 |
| 2023 | 0.00 | 0.00 | 0.00 | 4.73 | 7.45 | 2.91 |
| 2024 | 0.00 | 0.00 | 0.00 | 4.27 | 9.27 | 3.00 |
| 2025 | 0.91 | 0.00 | 0.18 | 1.64 | 8.27 | 4.27 |
| Year | Kawasaki | KTM | Suzuki | Triumph | Yamaha |
| 1998 | 11.25 | 1.00 | 11.17 | 0.00 | 11.50 |
| 1999 | 7.33 | 0.08 | 9.92 | 0.00 | 14.58 |
| 2000 | 5.42 | 2.42 | 9.00 | 0.00 | 8.58 |
| 2001 | 4.00 | 3.50 | 6.25 | 0.00 | 14.25 |
| 2002 | 2.25 | 3.33 | 4.58 | 0.00 | 12.33 |
| 2003 | 2.09 | 2.64 | 5.91 | 0.00 | 12.36 |
| 2004 | 2.58 | 1.33 | 6.83 | 0.00 | 9.92 |
| 2005 | 2.83 | 0.92 | 10.67 | 0.00 | 5.83 |
| 2006 | 4.67 | 0.00 | 9.17 | 0.00 | 4.83 |
| 2007 | 8.25 | 2.42 | 4.83 | 0.00 | 5.00 |
| 2008 | 4.92 | 2.25 | 5.75 | 0.00 | 6.75 |
| 2009 | 7.42 | 2.08 | 5.08 | 0.00 | 10.17 |
| 2010 | 9.83 | 2.67 | 6.42 | 0.00 | 12.83 |
| 2011 | 6.17 | 4.08 | 6.08 | 0.00 | 13.83 |
| 2012 | 9.92 | 4.83 | 8.17 | 0.00 | 6.92 |
| 2013 | 9.42 | 7.17 | 8.33 | 0.00 | 7.75 |
| 2014 | 5.50 | 9.92 | 6.00 | 0.00 | 7.75 |
| 2015 | 8.08 | 4.33 | 6.92 | 0.00 | 9.33 |
| 2016 | 3.83 | 8.17 | 7.17 | 0.00 | 10.33 |
| 2017 | 5.33 | 7.92 | 6.17 | 0.00 | 6.58 |
| 2018 | 3.50 | 9.83 | 4.25 | 0.00 | 8.25 |
| 2019 | 6.75 | 10.67 | 2.67 | 0.00 | 6.08 |
| 2020 | 8.33 | 9.78 | 4.67 | 0.00 | 5.78 |
| 2021 | 8.42 | 10.25 | 2.42 | 0.00 | 9.33 |
| 2022 | 5.92 | 9.42 | 1.83 | 0.00 | 7.50 |
| 2023 | 5.18 | 6.45 | 3.18 | 0.00 | 11.27 |
| 2024 | 3.82 | 7.00 | 3.18 | 0.00 | 10.73 |
| 2025 | 6.18 | 3.55 | 2.09 | 0.27 | 13.64 |