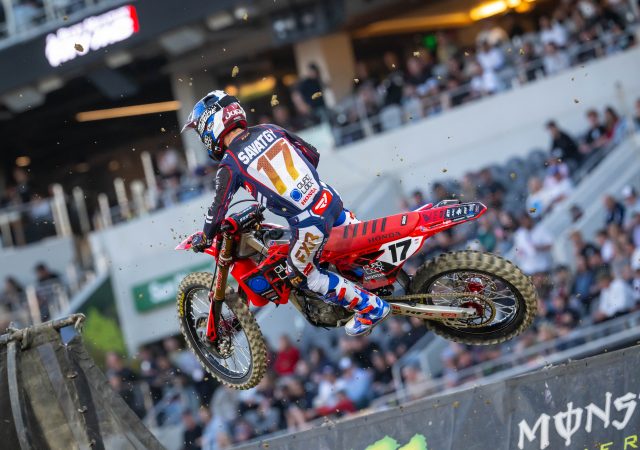
In 450 Moto 1 at High Point this year, Jett Lawrence lapped up to 10th place which seemed higher than normal to me. Especially given that Justin Barcia, a rider with four career 450 overalls was two minutes and 28 seconds behind in 10th.
This made me wonder how many riders tend to finish on the lead lap in 450 Motocross? We have Motocross laps data going back to 2004. Unfortunately, with Motocross laps data, there is quite a few rounds missing: 2004 Spring Creek, 2005 Steel City Moto 2, 2006 Hangtown, 2006 Steel City, 2007 Budds Creek, 2007 Freestone and 2008 Hangtown.
We have data for everything else in that timespan, which is still 467 motos to get data from!
I’ll break it down by Year, Moto, Venue and more.
Just covering the 450 Class for this and the data is updated through round 4 of the 2024 Pro Motocross season.
How many laps per moto are there?
First, I’ll cover how many laps we have on average.
In the 467 motos that we have data for, the average amount of laps per moto is 15.93.
Moto 1 since 2004 has averaged 15.97 laps per moto.
Moto 2 since 2004 has averaged 15.88 laps per moto.
The lowest number of laps we have had is just 9 laps at Unadilla Moto 2 in 2017 (that was a mud race).
The highest is 19 laps which has happened 5 times since 2004:
- Moto 1 and 2 at the Utah National at Miller Motorsports Park in 2014
- Moto 1 at Budds Creek in 2021
- Moto 1 and 2 at Ironman last year in 2023
| Total Laps | Instances |
| 9 | 1 |
| 11 | 1 |
| 12 | 2 |
| 13 | 16 |
| 14 | 29 |
| 15 | 99 |
| 16 | 170 |
| 17 | 114 |
| 18 | 30 |
| 19 | 5 |
Breakdown by Venue
| Venue | Motos w/ Data | Avg Laps per Moto |
| Miller Motorsports Park (Utah) | 6 | 18.00 |
| Muddy Creek (Tennessee) | 10 | 17.70 |
| Kenworthy’s Motocross Park | 2 | 17.00 |
| The Wick 338 (Southwick) | 34 | 16.59 |
| Freestone | 10 | 16.50 |
| Budds Creek | 36 | 16.47 |
| High Point | 40 | 16.40 |
| Lorreta Lynn’s | 4 | 16.25 |
| Ironman | 22 | 16.09 |
| WW Ranch | 4 | 16.00 |
| Spring Creek (Millville) | 38 | 15.97 |
| Hangtown | 36 | 15.94 |
| Thunder Valley | 40 | 15.90 |
| Washougal | 38 | 15.84 |
| Red Bud | 42 | 15.79 |
| Broome-Tioga (Binghamton) | 6 | 15.67 |
| Fox Raceway (Pala) | 20 | 15.50 |
| Unadilla | 38 | 15.11 |
| Lake Elsinore | 4 | 15.00 |
| Steel City | 15 | 14.93 |
| Glen Helen | 22 | 14.18 |
How many riders finish on the lead lap?
The average in the 467 motos we have data for is 15.50 riders per moto finishing on the lead lap.
In Moto 1, on average 15.93 riders finish on the lead lap.
In Moto 2, on average 15.05 riders finish on the lead lap.
The lowest amount of riders on the lead lap ever was: just one rider at Spring Creek 2006 Moto 2 when Ricky Carmichael lapped the entire field.
Other than that, the lowest is five riders at Southwick Moto 1 in 2004.
The record for most riders finishing on the lead lap is Hangtown Moto 1 in 2010, where 30 riders finished on the lead lap.
| Total Laps | Instances | Avg Lead Lap Riders |
| 9 | 1 | 13.00 |
| 11 | 1 | 15.00 |
| 12 | 2 | 5.00 |
| 13 | 16 | 14.19 |
| 14 | 29 | 16.28 |
| 15 | 99 | 17.38 |
| 16 | 170 | 15.90 |
| 17 | 114 | 14.60 |
| 18 | 30 | 12.27 |
| 19 | 5 | 9.40 |
Table put into a chart:
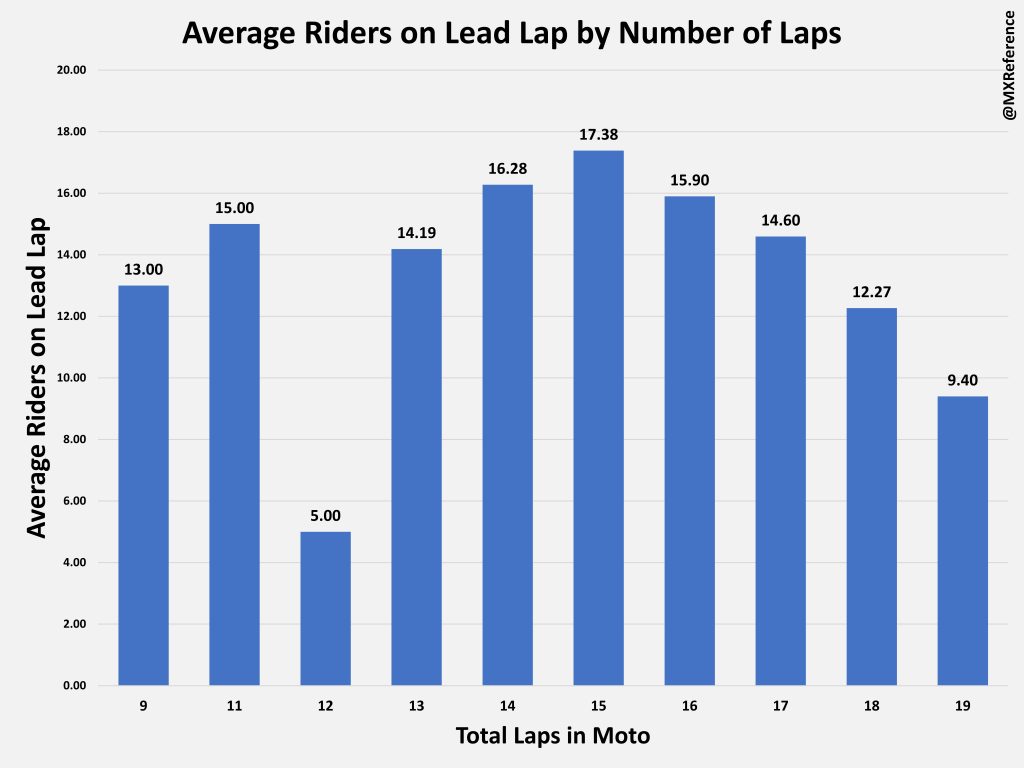
Hard to take much away from the instances with 9, 11 and 12 total laps with such low sample sizes. This is especially the case with the two 12 lap instances, one of them is Carmichael lapping everyone, skewing it lower.
But it is interesting and makes sense that the average number of riders on the lead lap goes down the more laps there are. There are only 5 instances of motos with 19 laps, so the fastest rider has to be on a much faster pace to begin with and then likely would have crossed the finish line right before the timer expired, making more time to lap riders.
Riders on Lead Lap by Year
| Year | Avg Riders on Lead Lap |
| 2004 | 13.86 |
| 2005 | 15.17 |
| 2006 | 13.15 |
| 2007 | 16.65 |
| 2008 | 18.50 |
| 2009 | 22.17 |
| 2010 | 20.21 |
| 2011 | 13.50 |
| 2012 | 17.71 |
| 2013 | 16.21 |
| 2014 | 12.92 |
| 2015 | 14.25 |
| 2016 | 14.46 |
| 2017 | 14.96 |
| 2018 | 13.33 |
| 2019 | 15.13 |
| 2020 | 13.39 |
| 2021 | 14.63 |
| 2022 | 14.79 |
| 2023 | 13.14 |
| 2024 | 18.88 |
Table put into a chart:
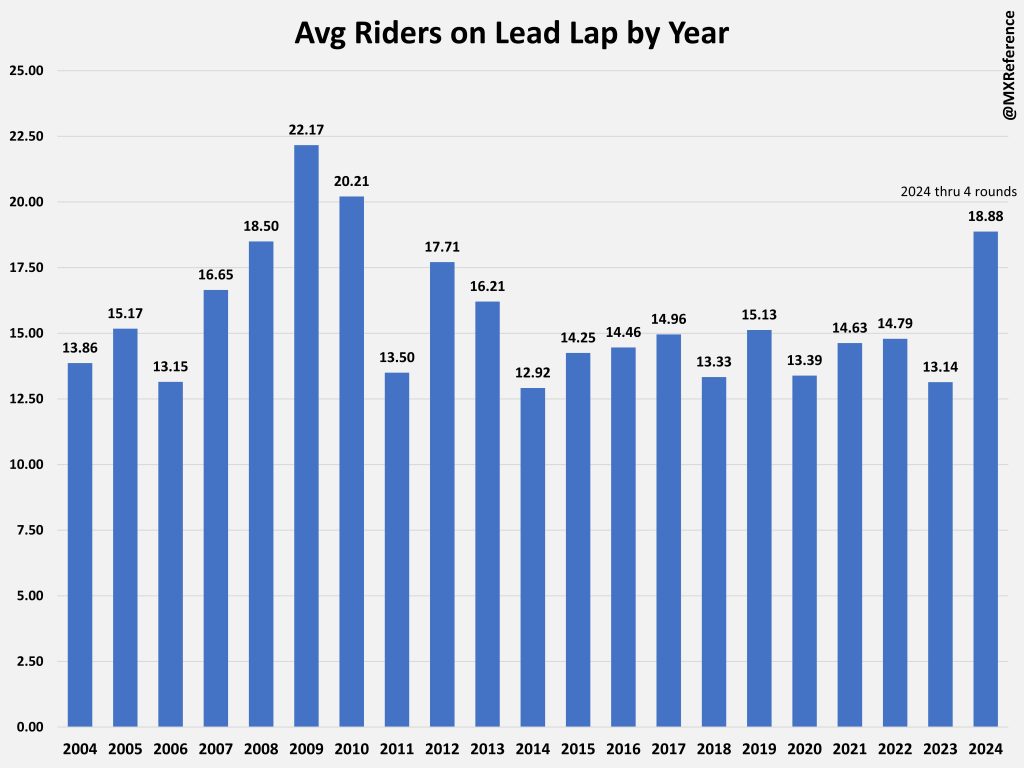
I would have thought in the perfect seasons 2004, 2008 and 2023 there would be less riders on the lead lap compared to other years. However, there seems to be no correlation to how dominant the championship rider was to how many riders are on the lead lap.
Riders on Lead Lap by Venue
| Venue | Motos w/ Data | Avg Riders on Lead Lap |
| Steel City | 15 | 19.87 |
| Thunder Valley | 40 | 18.53 |
| Washougal | 38 | 18.37 |
| Glen Helen | 22 | 17.55 |
| Freestone | 10 | 16.60 |
| Hangtown | 36 | 16.47 |
| Fox Raceway (Pala) | 20 | 15.90 |
| Unadilla | 38 | 15.68 |
| Lake Elsinore | 4 | 15.25 |
| Budds Creek | 36 | 15.22 |
| Red Bud | 42 | 14.76 |
| Spring Creek (Millville) | 38 | 14.21 |
| High Point | 40 | 13.95 |
| Muddy Creek | 10 | 13.90 |
| Ironman | 22 | 13.59 |
| WW Ranch | 4 | 13.00 |
| The Wick 338 (Southwick) | 34 | 12.62 |
| Lorreta Lynn’s | 4 | 11.75 |
| Kenworthy’s Motocross Park | 2 | 11.00 |
| Miller Motorsports Park | 6 | 11.00 |
| Broome-Tioga (Binghamton) | 6 | 10.50 |
After looking at this table and the table of total laps by venue, it appears that there is a an inverse correlation with the venues with MORE laps, then the less riders on the lead lap.
After filtering down to the venues with at least 10 motos of data, the rank correlation is -0.63:
| Venue | Avg Laps | Avg Laps RANK | Avg Riders on Lead Lap | Avg Riders on Lead Lap RANK |
| Muddy Creek | 17.70 | 1 | 13.90 | 13 |
| The Wick 338 (Southwick) | 16.59 | 2 | 12.62 | 15 |
| Freestone | 16.50 | 3 | 16.60 | 5 |
| Budds Creek | 16.47 | 4 | 15.22 | 9 |
| High Point | 16.40 | 5 | 13.95 | 12 |
| Ironman | 16.09 | 6 | 13.59 | 14 |
| Spring Creek (Millville) | 15.97 | 7 | 14.21 | 11 |
| Hangtown | 15.94 | 8 | 16.47 | 6 |
| Thunder Valley | 15.90 | 9 | 18.53 | 2 |
| Washougal | 15.84 | 10 | 18.37 | 3 |
| Red Bud | 15.79 | 11 | 14.76 | 10 |
| Fox Raceway (Pala) | 15.50 | 12 | 15.90 | 7 |
| Unadilla | 15.11 | 13 | 15.68 | 8 |
| Steel City | 14.93 | 14 | 19.87 | 1 |
| Glen Helen | 14.18 | 15 | 17.55 | 4 |
-0.63 is a fairly strong negative correlation.
Thanks for reading! Any questions, hit me up on Twitter or Instagram: @MXReference

