
Anaheim 1 feels like it is fast approaching as of writing this, Chase Sexton still hasn’t announced who he is riding for in 2027. I wanted to look back over time to see how correlated individual riders Race Finish is their holeshot position and qualifying position. I’ll break down the top and bottom 10 for Qualifying to Race Finish and then Holeshot Position to Race Finish. 450 Class only.
A couple notes:
- I have holeshot data from 2015-Present.
- Qualifying data dates back to 2007.
- Toronto 2008 Qualifying data is unavailable.
- The holeshot average is taken from Triple Crowns across the three races.
- Only riders with 20+ starts in the time period are being counted.
Lets get into it!
450 Supercross Highest Correlation from Qualifying Position to Race Finish | 2007-2026
*Minimum 20 Starts
| Rank | Rider | Starts since 2007 | Quali to Finish Corr. |
| 1 | Brandon Hartranft | 25 | 0.841 |
| 2 | Justin Starling | 49 | 0.714 |
| 3 | Chad Reed | 196 | 0.685 |
| 4 | Grant Harlan | 36 | 0.627 |
| 5 | Michael Byrne | 46 | 0.618 |
| 6 | Josh Hill | 99 | 0.615 |
| 7 | Tommy Hahn | 51 | 0.580 |
| 8 | Kyle Cunningham | 31 | 0.565 |
| 9 | Ben LaMay | 52 | 0.542 |
| 10 | Matthew Goerke | 39 | 0.539 |
| 11 | Kyle Chisholm | 185 | 0.537 |
| 12 | Fredrik Noren | 61 | 0.531 |
| 13 | Nick Wey | 115 | 0.520 |
| 14 | Adam Cianciarulo | 45 | 0.509 |
| 15 | Phil Nicoletti | 33 | 0.506 |
- Brandon Hartranft number 1! Real shame he had to retire due to injuries. His numbers are crazy consistent. Hartranft’s best ever qualifying position? 7th. His race finish that night? 8th. The biggest deviation he ever had between a qualifying position and race finish? 6 positions.
- Justin Starling’s average qualifying position through 49 instances that are counted here? 18.1 His Main finish average in those races? 17.27. Starling was within 1 Position difference in 18 of these races! (meaning if he qualified 18th, he finished between 17th and 19th)
- Huge sample size with Chad Reed here. This data captures his prime as well as when he regressed in pace over time. No surprise to see Reed ranking highly on a consistency stat.
- It is interesting to not see a ton of long time factory riders on this list other than Reed and Cianciarulo.
- And how about Chiz 11th here.
- Phil in 15th!
450 Supercross Lowest Correlation from Qualifying Position to Race Finish | 2007-2026
*Minimum 20 Starts
| Rank | Rider | Starts since 2007 | Quali to Finish Corr. |
| 1 | Zach Osborne | 34 | -0.199 |
| 2 | Tristan Lane | 24 | -0.105 |
| 3 | Chase Sexton | 92 | 0.042 |
| 4 | Blake Baggett | 94 | 0.056 |
| 5 | Dylan Ferrandis | 73 | 0.074 |
| 6 | Kyle Regal | 28 | 0.074 |
| 7 | Ryan Dungey | 134 | 0.101 |
| 8 | Ken Roczen | 179 | 0.105 |
| 9 | Hunter Lawrence | 36 | 0.109 |
| 10 | Ryan Villopoto | 92 | 0.111 |
| 11 | Paul Carpenter | 42 | 0.114 |
| 12 | Ryan Clark | 22 | 0.154 |
| 13 | Jett Lawrence | 21 | 0.154 |
| 14 | Jimmy Albertson | 39 | 0.157 |
| 15 | Eli Tomac | 198 | 0.159 |
- Zach Osborne and Tristan Lane with a negative correlation! While this is a negative correlation, they both are very close to zero so this really is just saying that there is almost no correlation with a slight negative correlation.
- A rider such as Dylan Ferrandis makes a lot of sense to me here. He was always a very inconsistent Supercross rider. And his qualifying positions were all over the place. Same story with Blake Baggett.
- What I find really fascinating on this list is the number of top tier riders: Sexton, Dungey, Roczen, the Lawrences, Villopoto, Tomac.
- Sexton makes some sense with how good of a qualifier he is to his variety of results in Supercross with a lot of crashes.
- However, I would have never predicted Dungey or Villopoto to be at the top of a lowest correlation list.
- My theory is that these riders have always been top level qualifiers in the Top 3 or Top 5 and there is not much room to improve position from there, only to go down. For example, if you qualify first, you can simply only match that or do worse.
- If you go from pole position to 4th in the main event, there is no way to counteract that and go from pole to -3.
- After seeing Sexton on here, I figured James Stewart would probably be close. Always a top qualifier and a lot of crashes, but Stew ranks 26th at 0.276. Interestingly, the two riders closest to him? JT at 0.273 and Alex Ray at 0.280.
450 Supercross Highest Correlation from Holeshot Position to Race Finish | 2015-2026
*Minimum 20 Starts. And this is since 2015.
| Rank | Rider | Starts since 2015 | Correlation |
| 1 | Brandon Hartranft | 25 | 0.672 |
| 2 | Jett Lawrence | 21 | 0.620 |
| 3 | Ryan Breece | 38 | 0.568 |
| 4 | Justin Starling | 49 | 0.548 |
| 5 | Kyle Chisholm | 123 | 0.536 |
| 6 | Chad Reed | 95 | 0.512 |
| 7 | Cole Seely | 70 | 0.506 |
| 8 | Colt Nichols | 50 | 0.502 |
| 9 | Christian Craig | 52 | 0.492 |
| 10 | Nick Wey | 21 | 0.481 |
| 11 | Broc Tickle | 73 | 0.477 |
| 12 | Mike Alessi | 43 | 0.461 |
| Zach Osborne | 34 | 0.461 | |
| 14 | Ryan Dungey | 51 | 0.455 |
| 15 | Josh Grant | 49 | 0.446 |
- Brandon Hartranft again leading the way! 24 of Hartranft’s 25 races, he was within 5 positions of his holeshot position by race finish. 17 of 25 were within 3!
- Another insane Jett Lawrence stat! Jett’s starts are seemingly always super impressive. Even when he hasn’t gotten the best start he comes the pack – which in turn actually hurts his score on this stat! Jett does have a smaller sample size, but I can’t imagine it differing that much with another 20 starts. He is by far the highest scoring top rider on this list.
- Chad Reed is here, however, its important to remember the holeshot data goes back to 2015 – past Reed’s prime in Supercross. Still impressive the correlation score.
- The next top level guy is Ryan Dungey.
- Riders like Roczen, Webb and Hunter Lawrence are more mid pack in this list.
- Despite having a negative correlation between qualifying to finish, Zacho Osborne is one of the higher ranked riders here!
450 Supercross Lowest Correlation from Holeshot Position to Race Finish | 2015-2026
*Minimum 20 Starts. And this is since 2015.
| Rank | Rider | Starts since 2015 | Correlation |
| 1 | Alex Ray | 59 | -0.083 |
| 2 | Dylan Ferrandis | 73 | 0.042 |
| 3 | Ben LaMay | 39 | 0.090 |
| 4 | Trey Canard | 32 | 0.100 |
| 5 | Nick Schmidt | 40 | 0.101 |
| 6 | Davi Millsaps | 40 | 0.117 |
| 7 | Fredrik Noren | 61 | 0.122 |
| 8 | Vince Friese | 122 | 0.162 |
| 9 | Chase Sexton | 92 | 0.170 |
| 10 | Mitchell Oldenburg | 35 | 0.174 |
| 11 | Tyler Bowers | 55 | 0.177 |
| 12 | Jake Weimer | 46 | 0.181 |
| 13 | Justin Brayton | 110 | 0.214 |
| 14 | Martin Davalos | 33 | 0.224 |
| 15 | Eli Tomac | 185 | 0.226 |
- Alex Ray with a negative correlation. Again, Ferrandis actually has less of correlation, but I rank them from lowest absolute score.
- Ferrandis actually has the lowest correlation here. This makes sense. Ferrandis was a very inconsistent starter. In fact he only ever holeshotted Top 5 in 12 of 73 starts. But there is absolutely no correlation to his race finishes.
- I am surprised that Vince Friese is not a negative correlation. Friese is a great starter and typically always moves backwards.
- Sexton is also not too surprising here, with a good start, he has a lot of crashes impacting his finishes. When he starts in the back, he tends to come through the pack. Across 92 races this essentially evens out to no correlation.
- Tomac makes the Top 15 for lowest correlations.
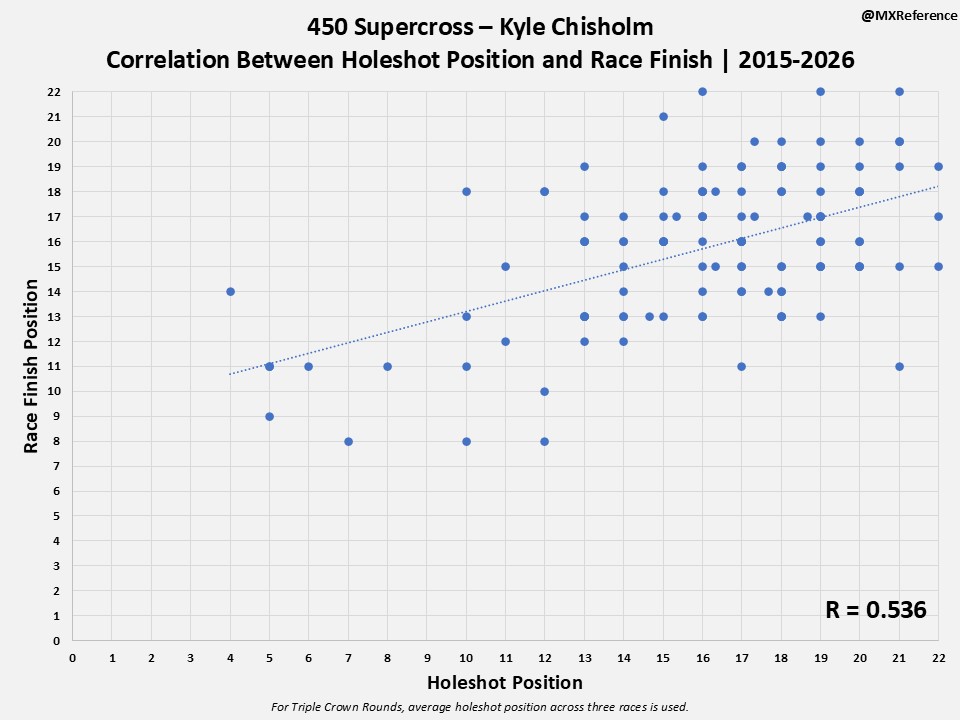
I wanted to visualize how this looks with riders with a high enough sample size, I will compare Kyle Chisholm to Dylan Ferrandis.
Chisholm has the 5th highest correlation but a huge sample size and Ferrandis has the lowest correlation with a pretty good sample size. This is comparing holeshot position to race finish.
Kyle Chisholm
Dylan Ferrandis
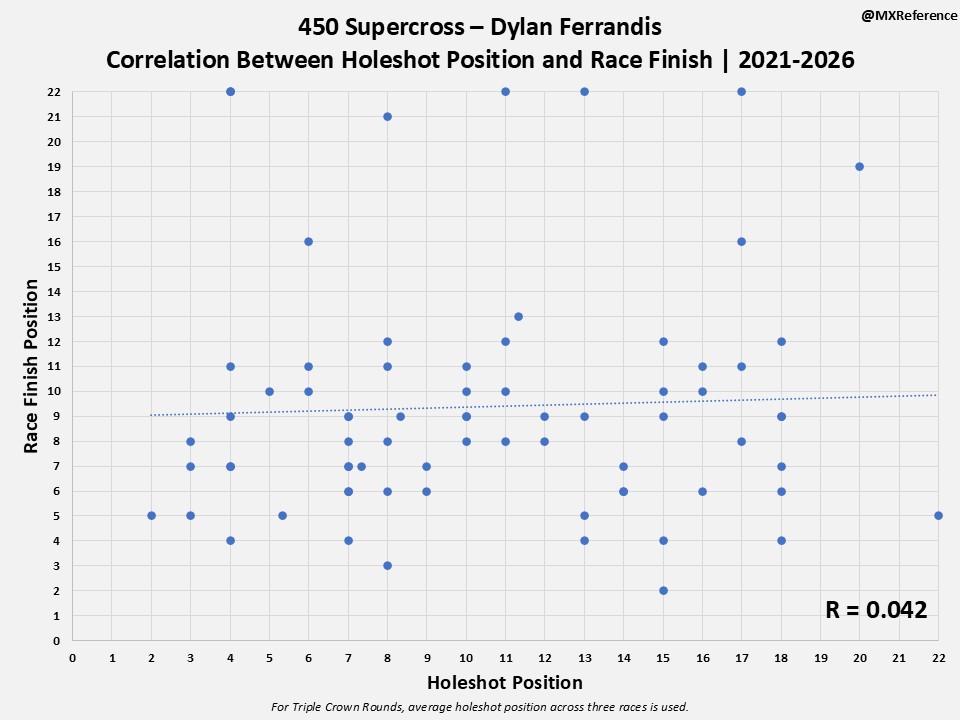
Good visual of the difference in correlation!
Thanks for reading! Any questions, hit me up on Twitter or Instagram: @MXReference.
