Earlier this year, I wrote an article on “Startcross” examining how rider’s holeshot positions at the white line was correlating to where they finished the race through the first 10 rounds of the season. You can read that here if you’re interested.
What we found was that essentially whoever started up front would then finish up front in 2024. So that leads to the question, has it always been this way?
Unfortunately, we can’t go back in time forever to find the Holeshot position of riders throughout Supercross history. However, I did collect the data dating back to 2015.
How did I get this data?
For 2024, Matthes sent me an excel sheet from the broadcast data.
However, before 2024 and dating back to 2015, I took the broadcast display graphic that showed the holeshot positions:
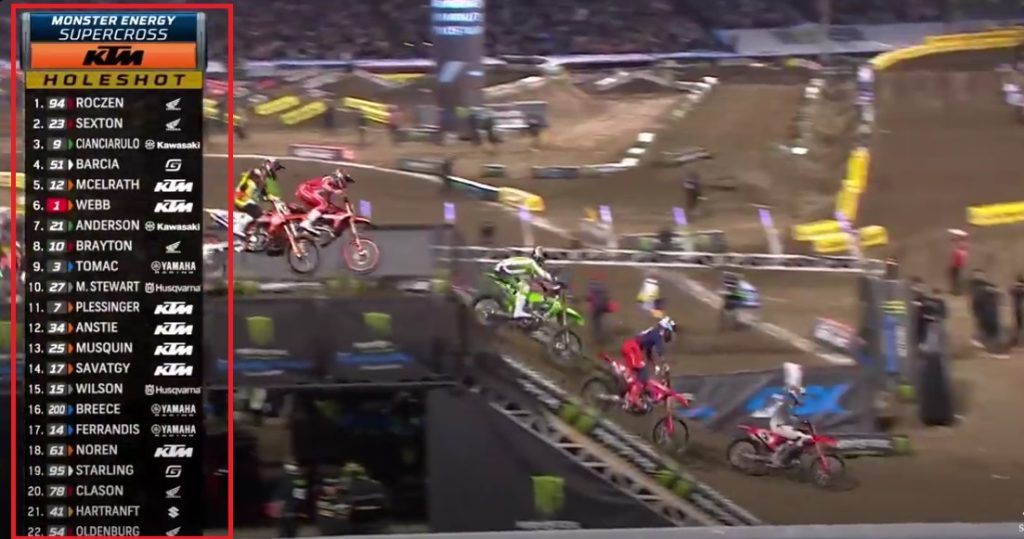
Here and there, I had to make some manual edits as at times this would display some incorrect positions. But overall, it was very accurate.
Many races throughout this period wouldn’t always display this graphic so I had to manually go frame by frame and recorded the data myself. (This took quite a long time!)
And I had to leave East Rutherford 2023 out of this data analysis as it is pretty impossible to identify each rider. Good luck to anyone trying to decipher who is who after the first few riders at the start of that race:

Quickly before getting to the data two quick important points:
- Holeshot position in this is measuring the order that riders get to the white line.
- Triple Crown races (the individual main events) are treated as regular mains in this analysis. It’s not perfect but I don’t think leaving them out was any better.
Long story short: the data isn’t 100% completely perfect, but it will still give us a lot of insight!
This article is entirely the 450SX Class.
Okay, finally onto the data! (This is a long article!)
Race Winners
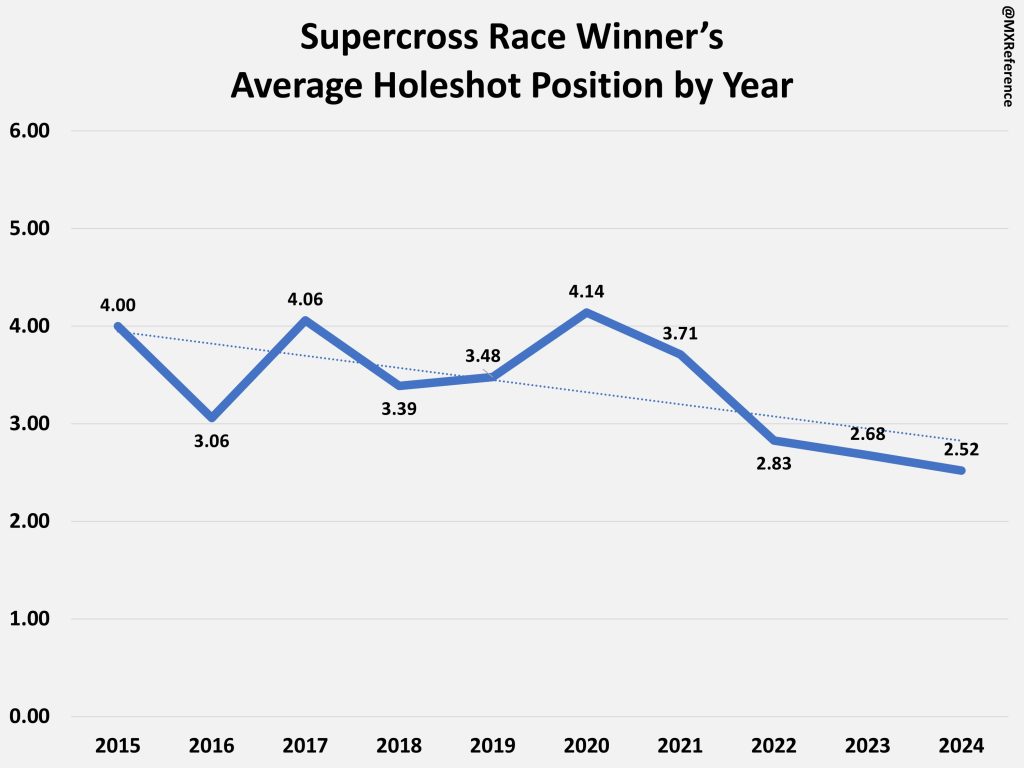
For the last 10 years, we can see the average holeshot position for race winners is on average lower than 5th. From 2015 – 2021, the average is pretty flat overall despite the volatility. Overall winner’s average holeshot position has been trending lower, with a bigger drop the last three seasons.
So this is just the average position, so often do race winners holeshot in the Top 3 or Top 5?
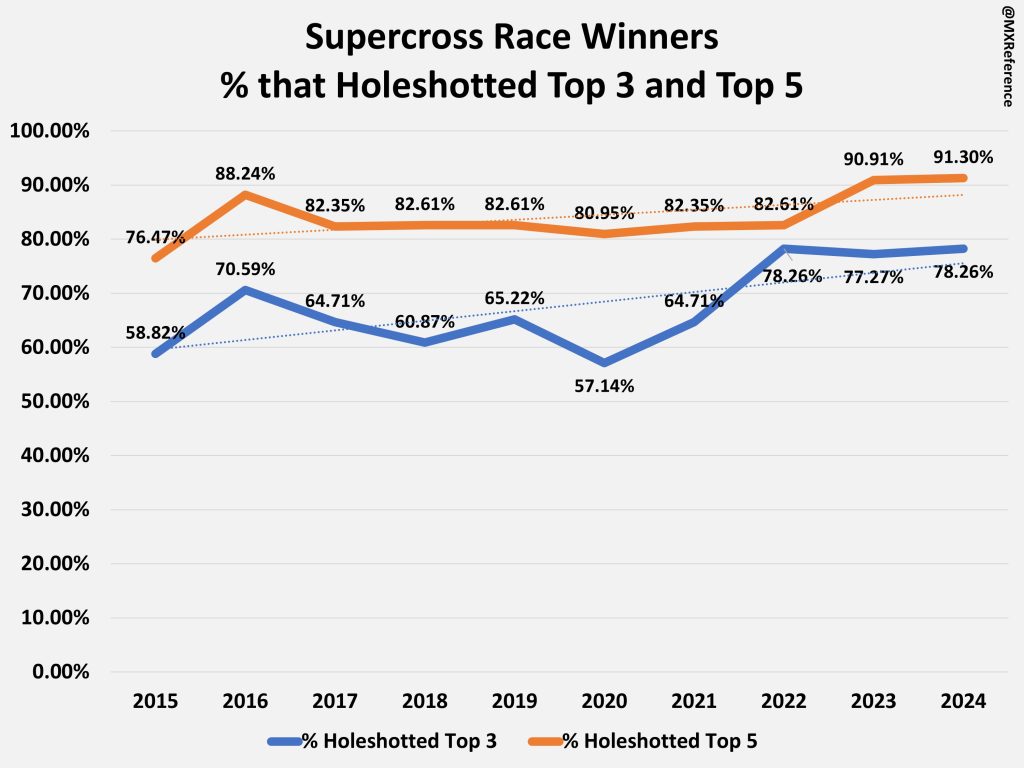
This chart is showing how often the race winners by year holeshot in the first 3 or 5 positions.
- 2015 stands out as being a little lower in both categories (more on 2015 later).
- We can see the Top 3 steadily increasing, pointing to more “Startcross”
- In the last three years, we can see a decent jump to over 75% of race winners holeshotting within the Top 3.
- 2020 is kind of outlier in this chart, and you’ll see that in some other charts as well.
Podium Finishers
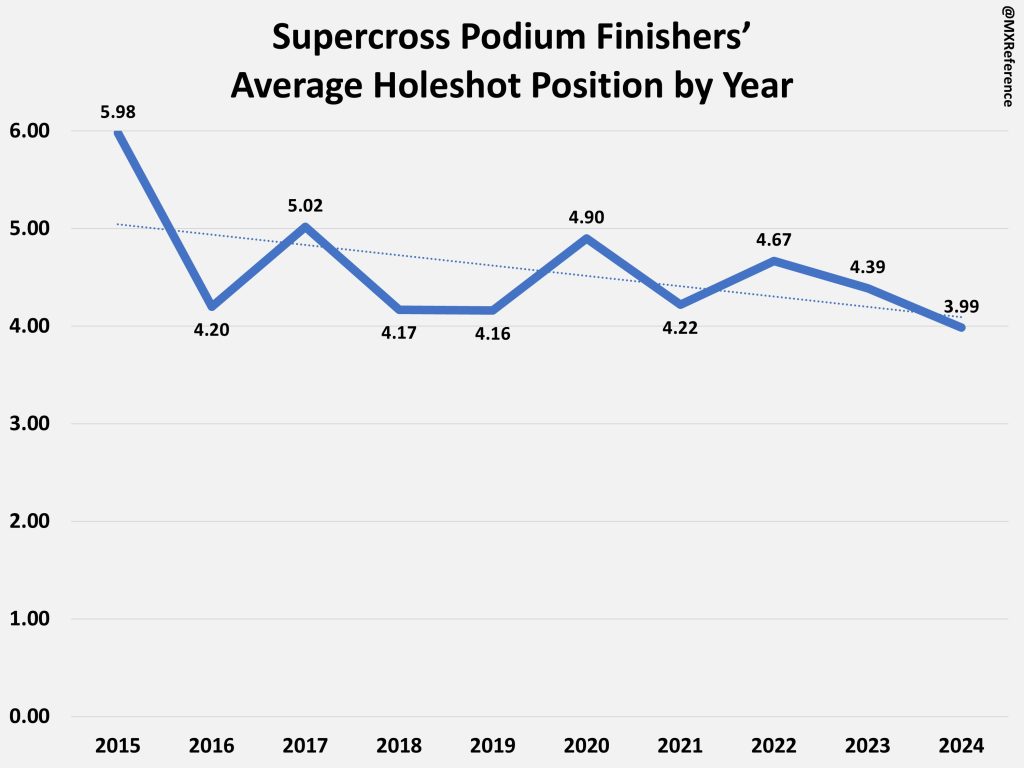
We can see that riders finishing on the podium have averaged lower and lower holeshot positions, once again pointing to “Startcross”
- One thing to point out here is that the trendline is a bit steeper due to 2015
- Didn’t make the Top 3/Top 5 holeshot position rate chart for podium finishers as we are now including multiple riders
Okay so we have looked at Race Winners and Podium Finishers, but what about the rider who actually gets the holeshot?
Riders with Holeshot
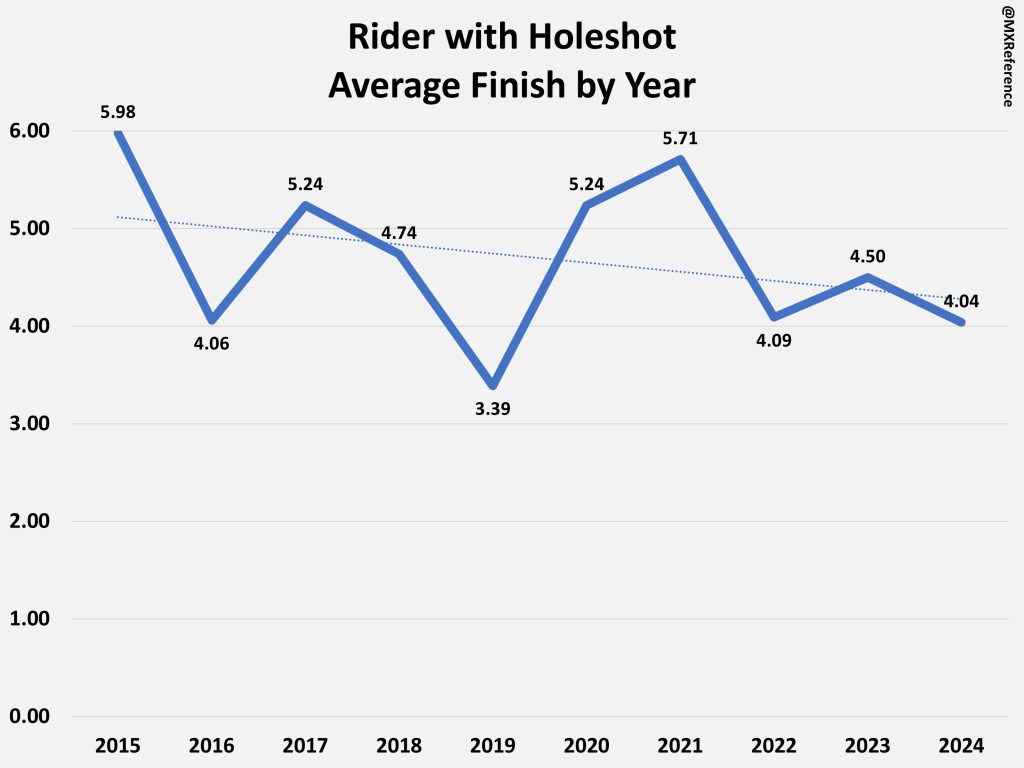
The rider with the holeshot has a pretty low average finish. And remember when you holeshot, you can only lose positions! This data is also likely a little skewed by riders who holeshot and then DNF or crash out. Either way, this is trending downwards. 2019 saw the lowest average finish of 3.39 on average.
On average, how often does the rider with the holeshot Win or Podium?
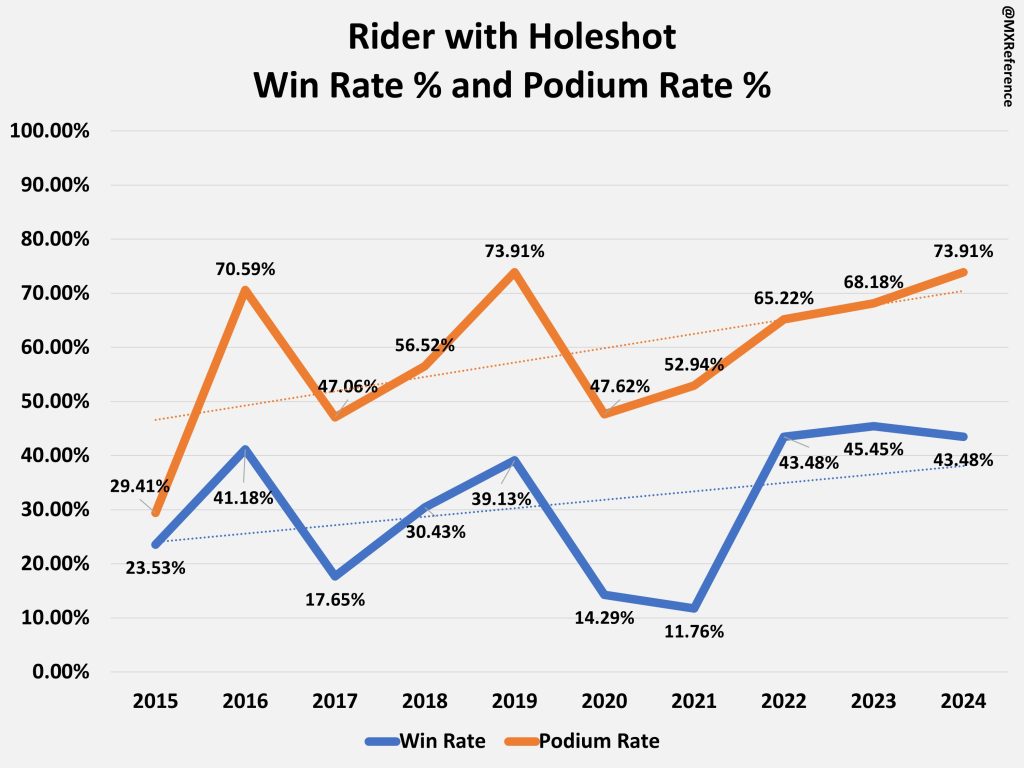
The win rate and podium rate for the holeshot rider is steadily increasing.
- 2020 and 2021 seem like outliers here
- I think this chart is pretty telling, think about it, nearly 75% of the time in 2024 the rider who holeshotted finished the race on the podium!
- These figures are more volatile, however, they both show better and better results for getting the holeshot.
- For perspective, just 6 times in 2024 the rider with the holeshot didn’t finish on the podium.
- Who were those riders? Vince Friese, Mitchell Oldenburg, Justin Cooper x2, Jorge Prado and… Jett Lawrence
- Jett’s instance was in Dallas when he crashed twice late in the race
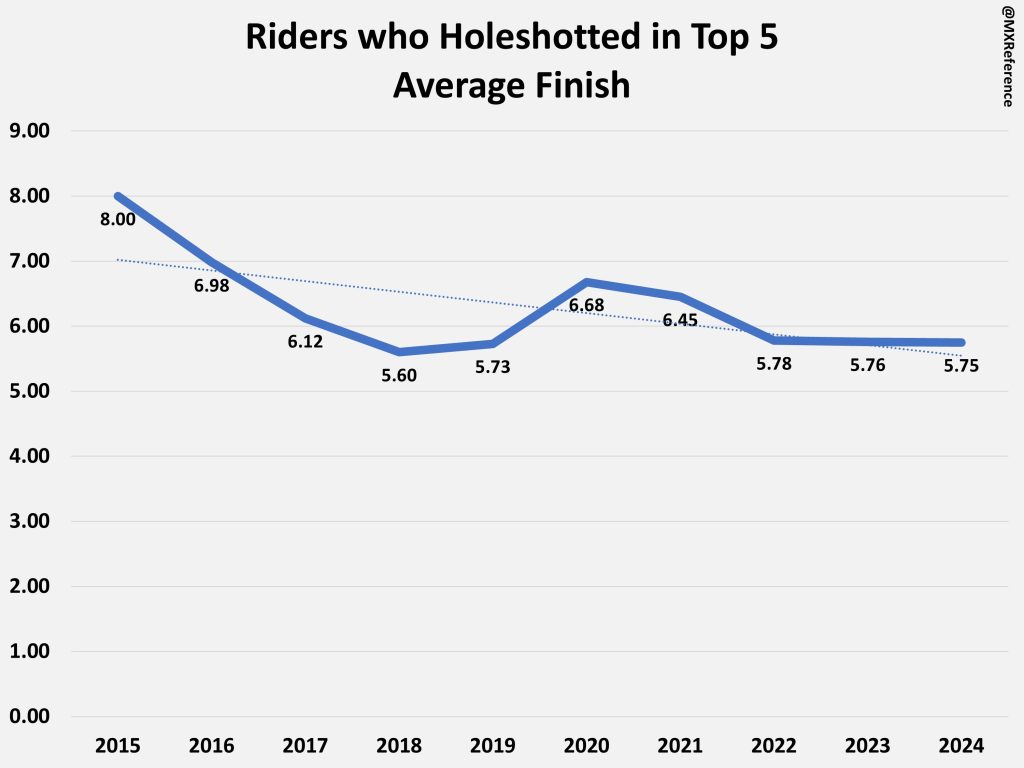
How are riders who holeshotted in the Top 5 faring?
We can see riders that holeshot in the Top 5 have also seen better and better results the last decade:
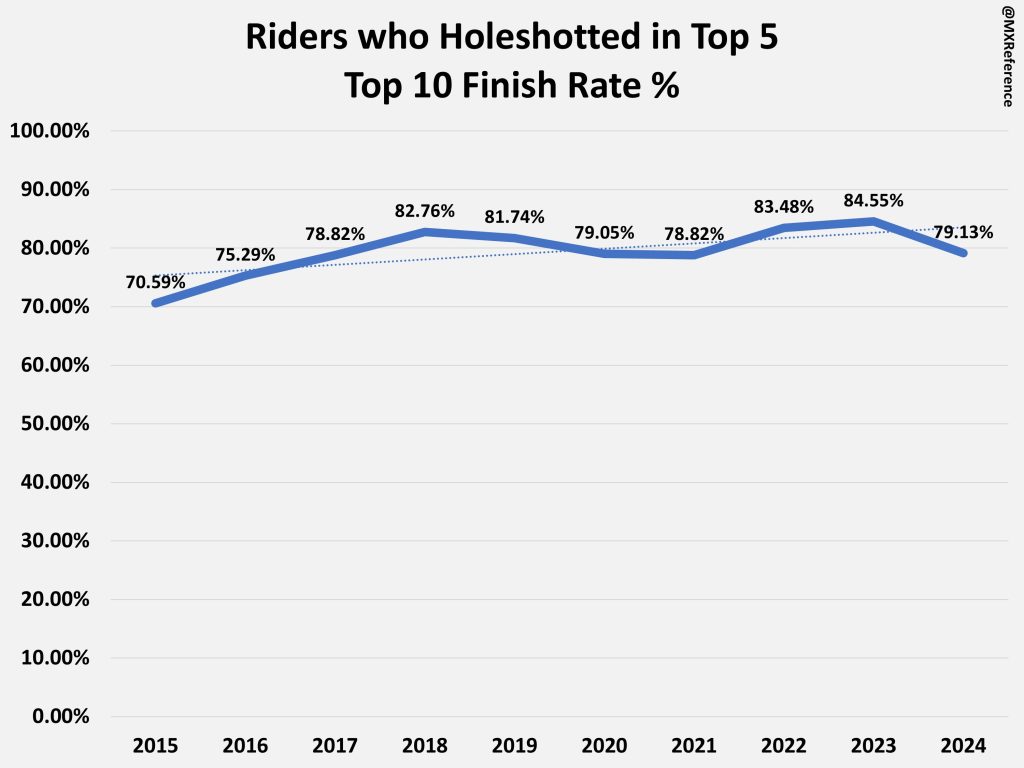
Furthermore, the rate in which riders who holeshot in the Top 5 have seen increasing rates of finishing in the Top 10:
Lap Leaders
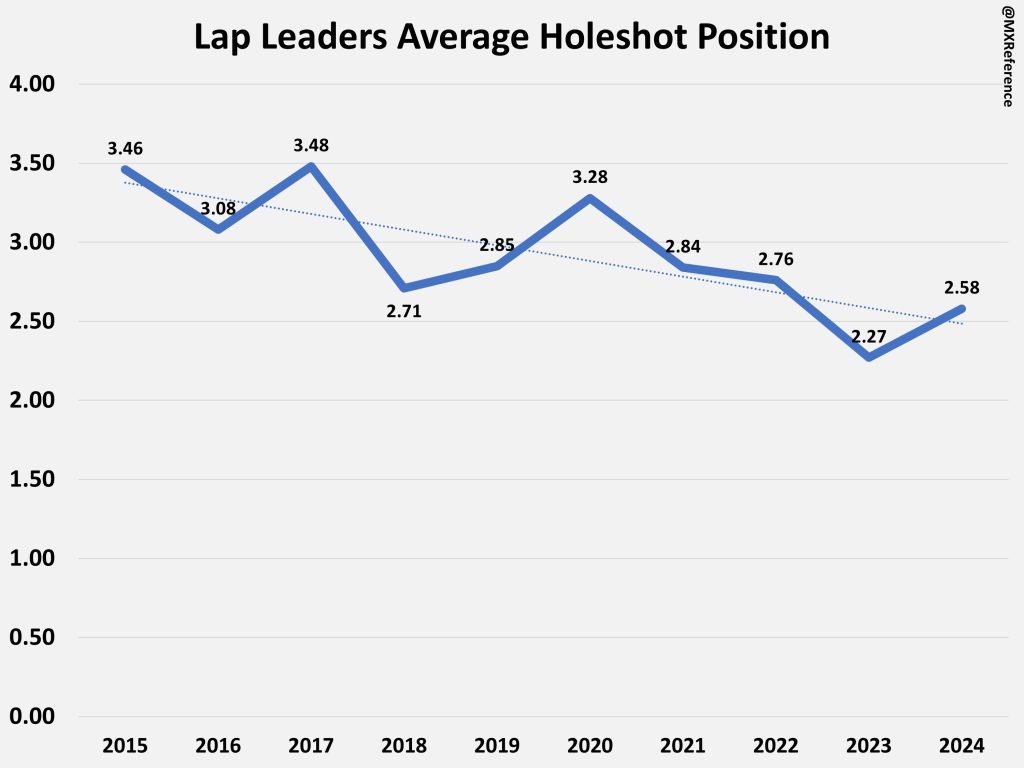
When looking at the different instances where riders lead laps, this average holeshot position has been trending lower as well:
So we have looked at a lot of averages, but how do these data figures truly correlate?
Correlations
Reminder: Correlation ranges from -1 to 1. The closer to 1, the higher the (positive) correlation.
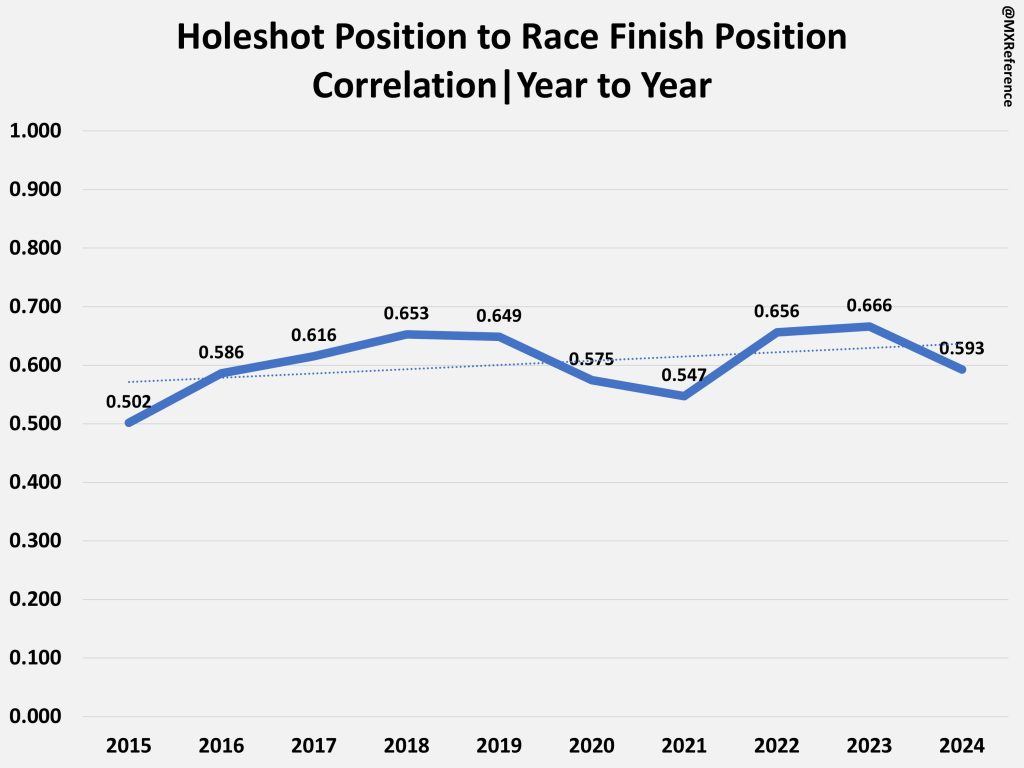
Looking at the all Supercross holeshot to finishing positions in this chart here. We can see the correlation is trending higher and is positive, but its not super strong.
However, when we adjust to do a rank correlation we see a much stronger picture.
This next chart is taking the average holeshot position rank among riders in 2024 compared to their average race finish rank. So for Example, Jett Lawrence had both the best holeshot position average and race finish average. Ranked 1st in both.
Remember, Triple Crown races are treated the same as regular main events in this!
NOTE: this chart only includes the riders who made more than 50% of the gate drops in 2024 (so a rider like Jorge Prado won’t be included):
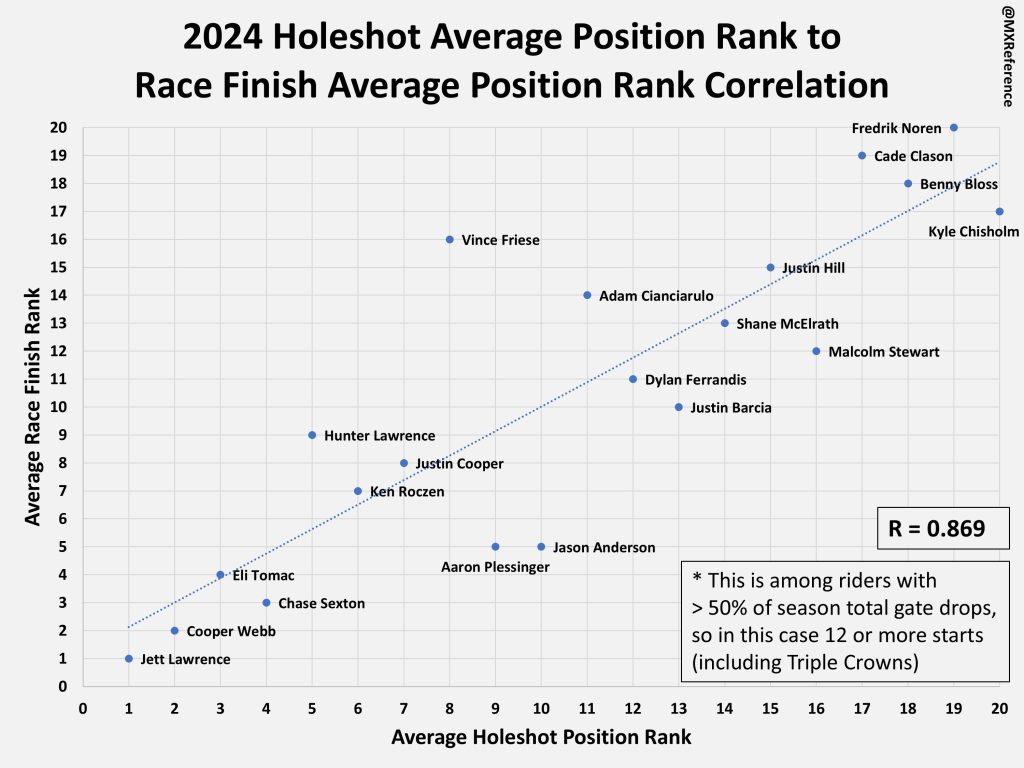
In this photo Aaron Plessinger and Jason Anderson are on the same line as they had the same race finish average.
This is pretty highly correlated at 0.869. So how does the 2024 correlation of 0.869 compare to the last 10 years?
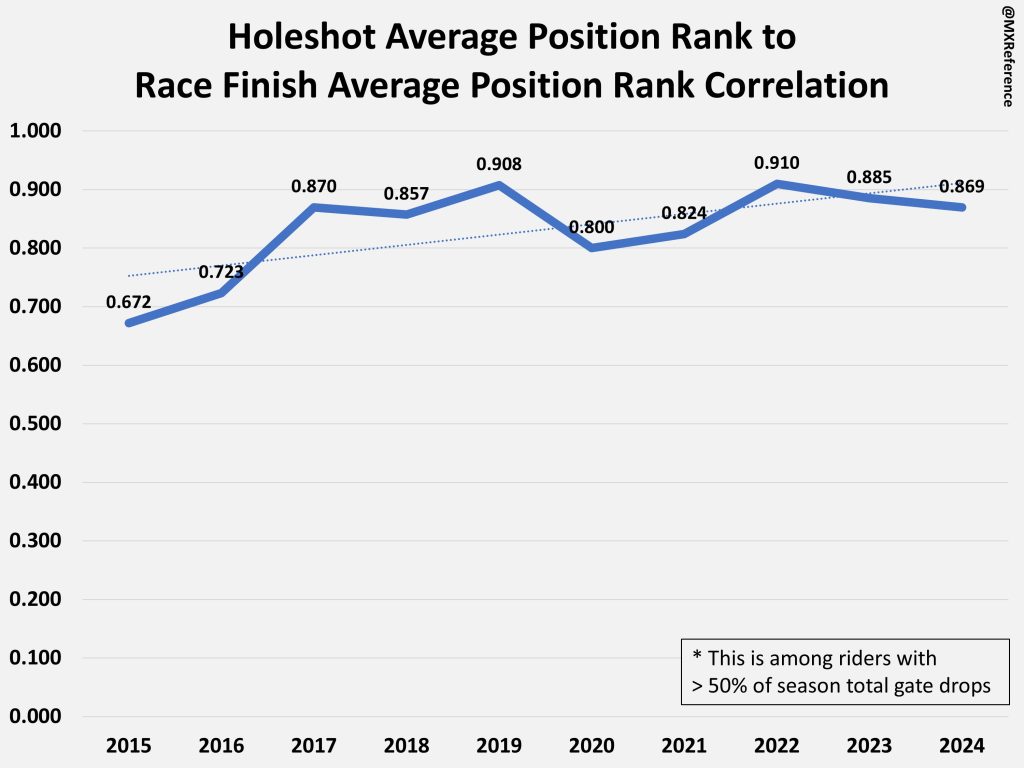
We can once again see this trending upwards.
Taking the same holeshot average position rank, we can do the same thing with Championship finish rank (of riders with over 50% of the starts):
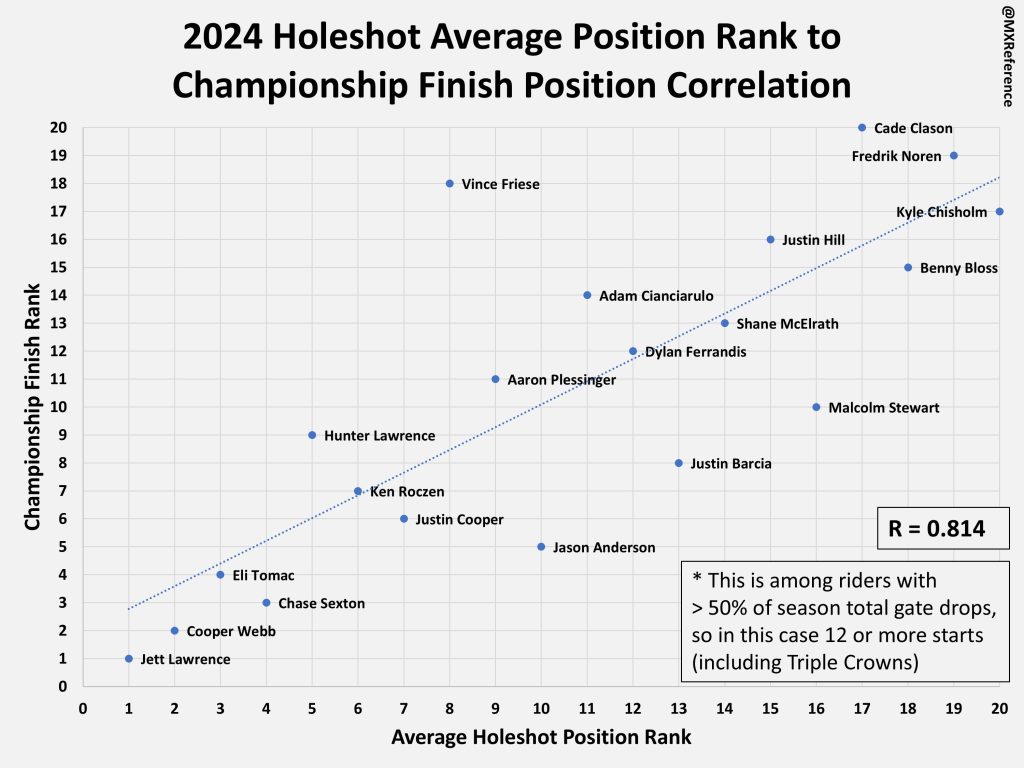
A slightly lower correlation of 0.814 compared to the race finish averages, however, we can still draw similar conclusions.
Here is the correlations for holeshot average rank to championship finish rank since 2015:
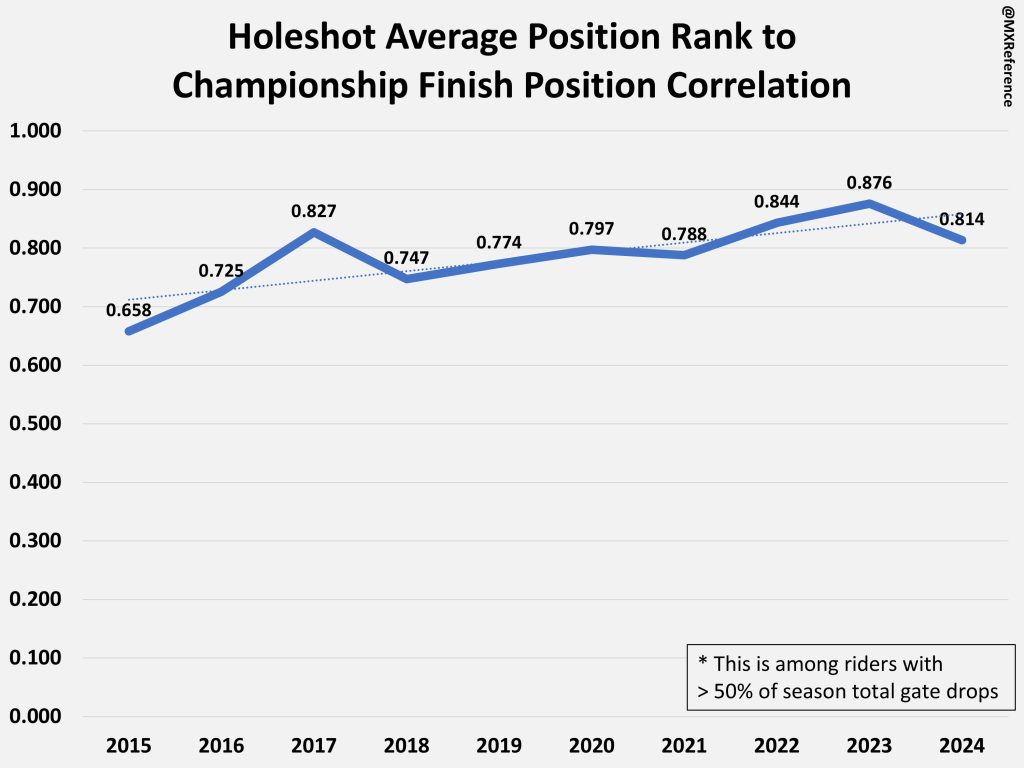
Another upwards trend.
I think its fair to say based on the figures here, Supercross has always been a bit of “Startcross.” However, its trending higher since 2015 in multiple different statistics. That said, over the years examined in this analysis, 2015 is the lowest for almost every metric.
2015 was a very interesting year with the holeshot stats, as Andrew Short had 7 of the 17 holeshots, including a stretch of 5 consecutive ones. Of those 7 holeshots, Short only finished in the Top 5 for one of them.
Does correlation mean causation?
In the case of holeshots, it think its fair to say there is some causation from holeshot position to race finish position but that would require a deeper regression analysis, something I’m willing to do at some point!
Other Interesting Findings
Champions Holeshot Averages
| Year | Champion | Holeshot Avg | Holeshot Rank |
| 2015 | Ryan Dungey | 4.12 | 2 |
| 2016 | Ryan Dungey | 2.94 | 1 |
| 2017 | Ryan Dungey | 7.53 | 4 |
| 2018 | Jason Anderson | 6.78 | 5 |
| 2019 | Cooper Webb | 5.13 | 1 |
| 2020 | Eli Tomac | 9.05 | 7 |
| 2021 | Cooper Webb | 5.06 | 1 |
| 2022 | Eli Tomac | 4.95 | 2 |
| 2023 | Chase Sexton | 4.82 | 2 |
| 2024 | Jett Lawrence | 5.13 | 1 |
- Interesting to look at Dungey’s 2017 average vs 2015 and 2016. Obviously, Dungey didn’t have the same speed in 2017 vs 2015/2016. However, quite a drop in Holeshot average
- Tomac in 2020 having the worst average holeshot position among champions is not too surprising
- It is also interesting to see that Dungey’s 2015 average of 4.12 wasn’t the best average for 2015, however, it is the second lowest among champions in the last 10 years
- Rank is once again among riders with > 50% of starts
Rider with the Most Wins Each Season Holeshot Averages
| Year | Rider w/ Most Wins | Wins | HS Avg | HS Rank |
| 2015 | Ryan Dungey | 8 | 4.12 | 2 |
| 2016 | Ryan Dungey | 9 | 2.94 | 1 |
| 2017 | Eli Tomac | 9 | 5.00 | 1 |
| 2018 | Eli Tomac | 8 | 4.05 | 1 |
| 2019 | Cooper Webb | 7 | 5.13 | 1 |
| 2020 | Eli Tomac | 7 | 9.05 | 7 |
| 2021 | Cooper Webb | 8 | 5.06 | 1 |
| 2022 | Eli Tomac | 7 | 4.95 | 2 |
| 2022 | Jason Anderson | 7 | 4.52 | 1 |
| 2023 | Eli Tomac | 7 | 3.67 | 1 |
| 2024 | Jett Lawrence | 8 | 5.13 | 1 |
This was most interesting thing I found in this analysis, outside of 2015 and 2020, the rider with the most (or tied for the most) wins has had the best holeshot average among the field.
- 2015 Ryan Dungey had a great average, however, Andrew Short was incredible with his holeshot starts that year besting Dungey in holeshot average
- 2020 Eli Tomac is the only one with not very good holeshot average to get the most wins in a season
- 2022 had Jason Anderson and Eli Tomac tying for 7 wins each, they were one and two for holeshot averages that year.
Going Forward
This was a lot of data to dig through and it certainly seems like “Startcross” is the takeaway here. I’ll continue to track holeshot data going forward and do some more analysis, including deep dives into individual riders. It would be great to expand backwards even more, which I could probably do. Its hard to go back too far with watching races on YouTube or other places online. Before 2013ish, most race recording are pretty low quality, so deciphering who is who at the white line would be more challenging.
Anyways, hope you enjoyed this article if you made it this far!
Any questions or feedback, hit me up on Twitter or Instagram: @MXReference

